CH14: Reporting and Communication
Introduction
An incident detected but not communicated might as well not have been detected. A vulnerability remediated but not reported to stakeholders provides no assurance to customers or regulators. A lesson learned by one analyst but not documented or shared disappears when the analyst leaves the organization.
Communication is as critical to security as the technical work that precedes it. A SOC analyst detecting a critical vulnerability, an incident response team containing a breach, and a threat hunter discovering an advanced attack all depend on effective communication to drive action, build trust, and improve organizational security.
This chapter covers reporting across three contexts: vulnerability management (communicating risks to remediate), incident response (communicating compromise and response), and strategic communication (reporting to leadership and external stakeholders). It addresses the reporting requirements unique to regulated industries, the metrics that matter to different audiences, and the communication techniques that build credibility and drive action.
By the end of this chapter, you will understand how to craft reports for different audiences, communicate security findings effectively, and build the reporting infrastructure that makes security a shared organizational responsibility.
Learning Objectives
Upon completing this chapter, students will be able to:
- Create vulnerability management reports that prioritize risks, communicate business impact, and guide remediation decisions.
- Communicate incident findings to technical teams, management, customers, and regulators using appropriate formats and terminology.
- Develop after-action reports and communicate lessons learned to improve incident response and defense.
- Select and track metrics that demonstrate the value and effectiveness of security programs.
14.1 Vulnerability Management Reporting
Vulnerability management produces a continuous stream of findings: software versions with known exploitable vulnerabilities, missing patches, misconfigurations. Organizations without effective vulnerability reporting accumulate thousands of vulnerabilities, making it impossible to prioritize remediation.
Scan Reports and Risk Scorecards
Vulnerability scan reports present findings from automated scanning (Nessus, OpenVAS, Qualys). Raw scan reports contain thousands of findings. Effective vulnerability reporting distills findings into actionable intelligence.
Risk scorecard format highlights critical findings:
| System | Vulnerability | Severity | CVSS | Impact | Remediation | Target Date |
|---|---|---|---|---|---|---|
| prod-db-001 | SQL Server RCE (CVE-2023-21911) | Critical | 9.8 | Database compromise, data exfiltration | Apply patches for SQL Server 2019 CU12 or later | 2024-02-15 |
| web-app-prod | Insecure direct object references (IDOR) | High | 7.5 | Unauthorized data access to customer records | Code review and access control remediation | 2024-03-01 |
| mail-server | OpenSSL DES vulnerability (CVE-2024-1234) | Medium | 5.3 | Weak encryption, potential eavesdropping | Update OpenSSL to 3.2+ | 2024-03-15 |
The scorecard shows:
- Critical findings first: Severity drives prioritization. Critical vulnerabilities on internet-facing systems are addressed first.
- Business impact: Communication describes risk in business terms, not technical jargon. "Database compromise, data exfiltration" is more compelling than "CVE-2023-21911 permits unauthenticated remote code execution."
- Clear remediation path: Does the vulnerability require a patch, configuration change, or architecture redesign?
- Target date: A deadline creates accountability. Without dates, vulnerability remediation drifts indefinitely.
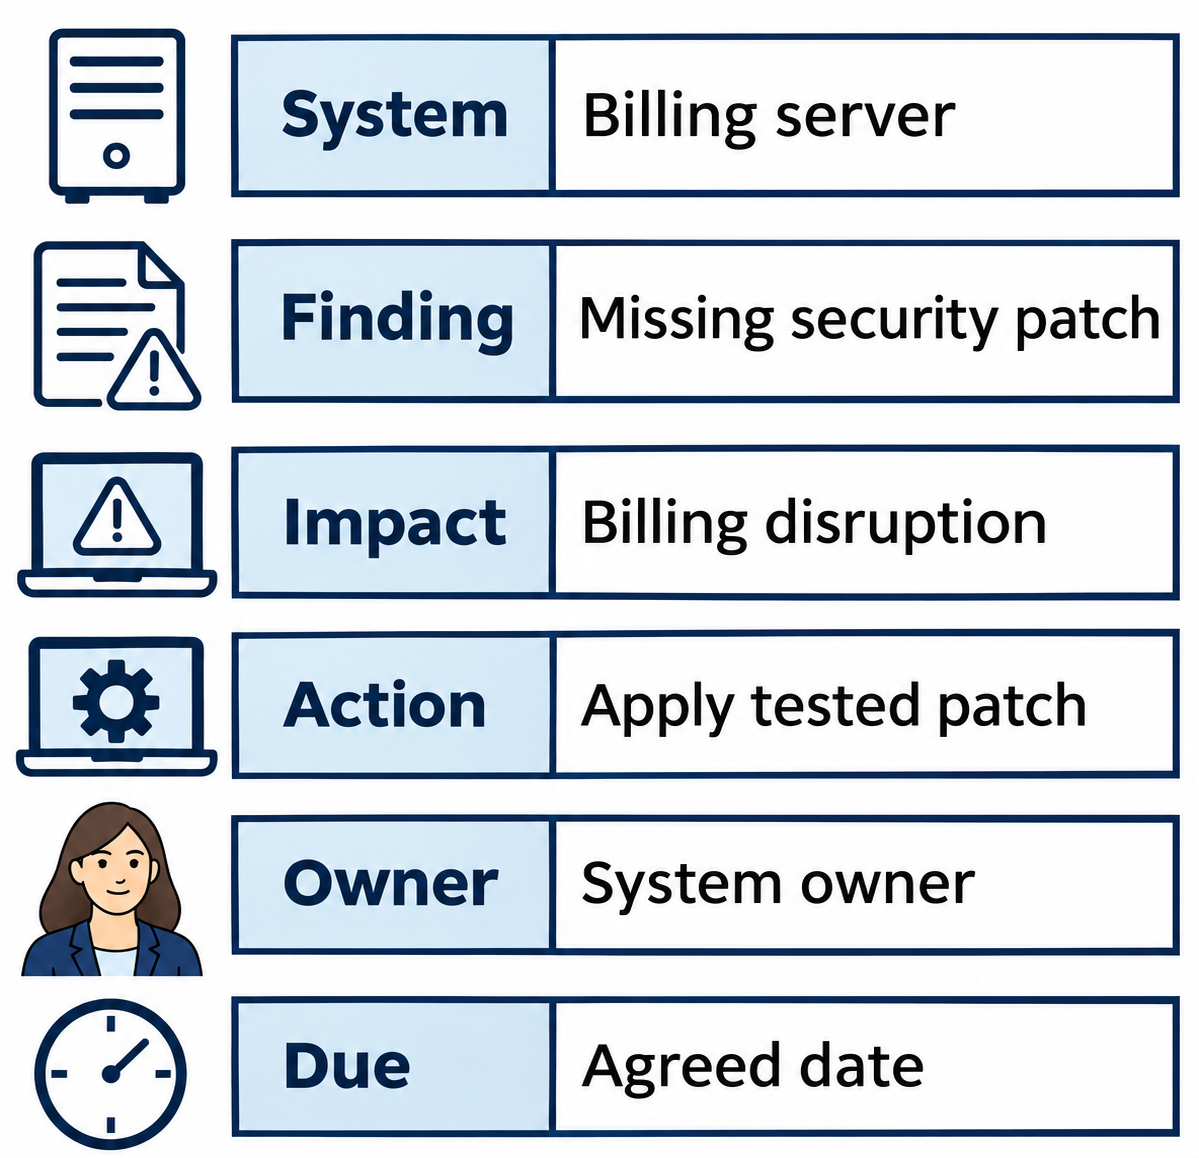
Figure 14.1: A risk scorecard connects a finding to its business impact, required action, owner, and due date.
Text description for Figure 14.1
Read the report from top to bottom: system, finding, business impact, action, owner, and due date. This synthetic example concerns a missing security patch on a billing server. The system owner must apply the tested patch by an agreed date. The figure deliberately omits product versions and vulnerability identifiers.
Inhibitors to Remediation
Not all vulnerabilities can be remediated immediately. Remediation inhibitors are legitimate reasons why a vulnerability persists:
- Patch unavailable: Vendors have not released a patch for the operating system version in use (legacy systems).
- Business interruption: Applying a patch requires system downtime, disrupting critical business operations. Hospitals cannot take their patient management system offline during patient care hours.
- Contractual constraints: Software vendors prohibit modifications to systems without paying for support contracts. The organization may not budget for extended support.
- Legacy systems: End-of-life systems no longer receive patches. The organization is working on replacing the system but the replacement takes time.
- Third-party dependency: The organization does not control the vulnerable component. A SaaS provider has not patched their system; the organization is waiting for the vendor to remediate.
Effective vulnerability reporting documents inhibitors, sets target remediation dates for removing inhibitors (e.g., "Legacy billing system will be decommissioned by Q3 2024"), and ensures stakeholders understand trade-offs.
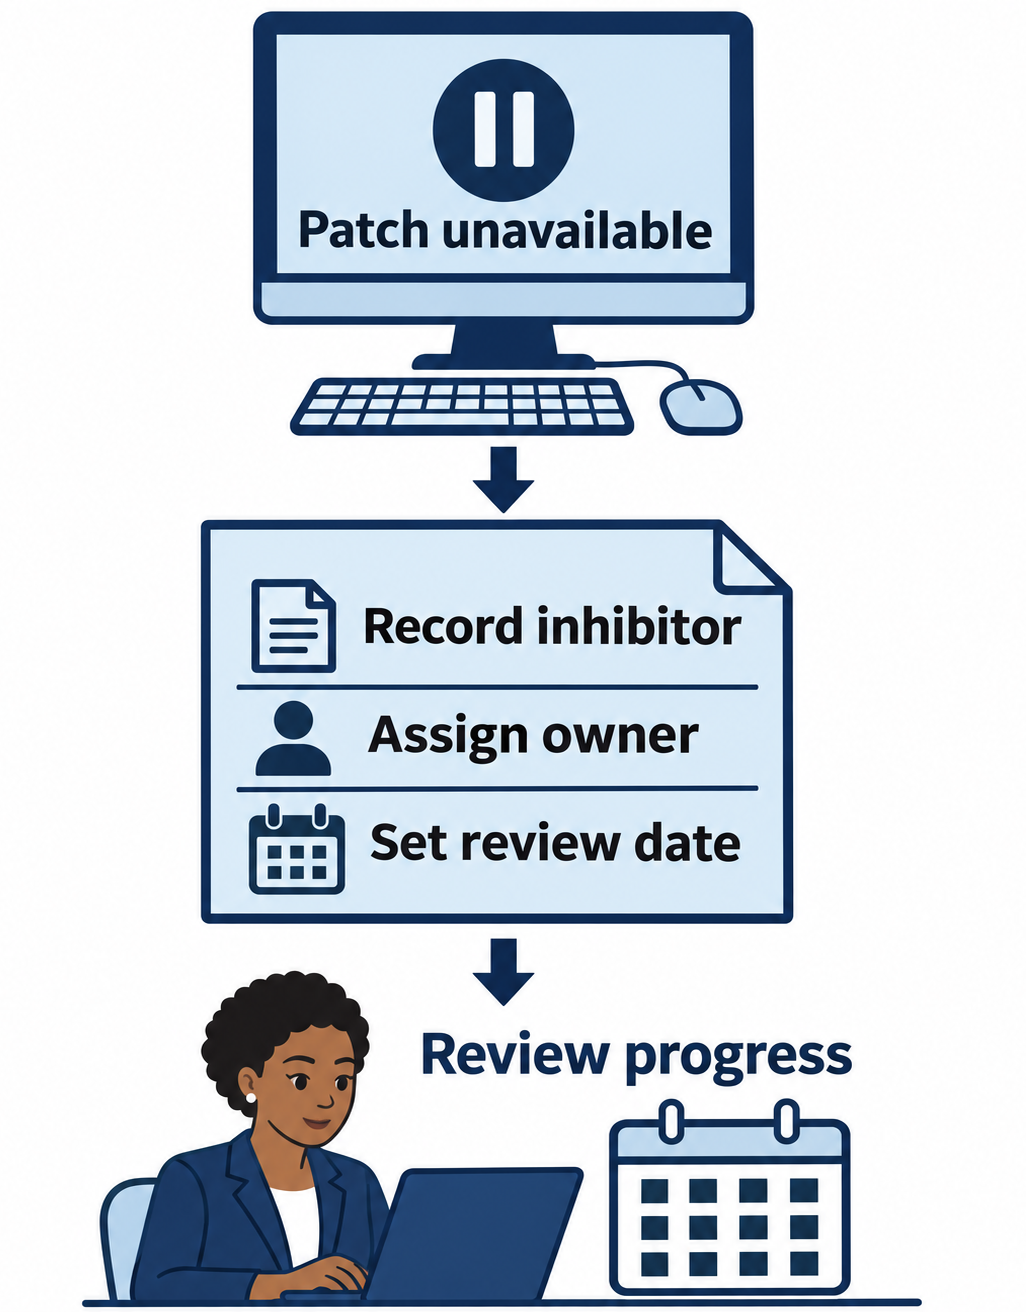
Figure 14.2: An inhibitor record keeps a delayed remediation task visible and assigned.
Text description for Figure 14.2
When a patch is unavailable, record the obstacle, assign an owner, and set a review date. The owner follows up on the dependency and updates the remediation plan. The record documents continuing work without implying that recording the inhibitor removes the vulnerability.
Vulnerability Metrics and Trending
Vulnerability trending shows whether the organization's vulnerability posture is improving or degrading:
- Vulnerability count over time: Are new vulnerabilities being discovered faster than they are being remediated?
- Mean time to patch: For vendors who release patches, how long does it take for the organization to apply them?
- Critical vulnerability age: How long do critical vulnerabilities persist unpatched?
- Remediation rate: What percentage of vulnerabilities are remediated within SLA?
Example metrics:
| Metric | Target | Current | Status |
|---|---|---|---|
| Critical vulnerabilities patched within 30 days | 95% | 78% | Underperforming |
| High vulnerabilities patched within 60 days | 90% | 84% | On track |
| Mean time to remediate critical vulnerabilities | 15 days | 22 days | Underperforming |
These metrics reveal trends and identify where the organization is struggling. If critical vulnerabilities are not being patched within SLA, root causes might be: lack of resources, lack of automation, or prioritization challenges.
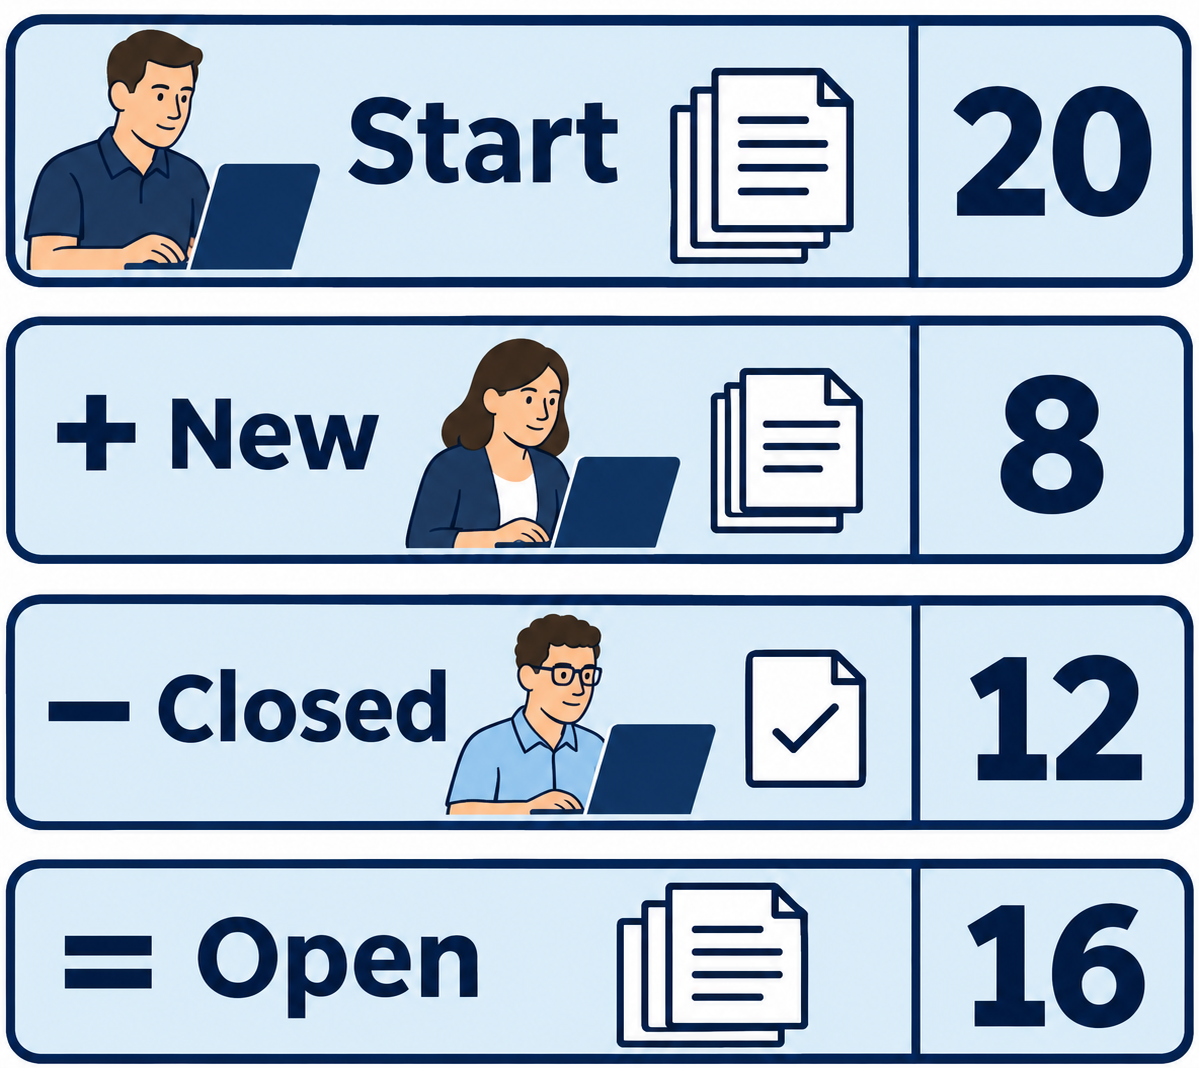
Figure 14.3: A synthetic monthly example shows how new and closed findings change the open backlog.
Text description for Figure 14.3
In this synthetic month, the opening backlog contains 20 findings. The team adds 8 newly discovered findings and closes 12, leaving 16 open findings. Compare periods using consistent scan coverage and closure rules. A change in discovery volume alone does not establish whether security improved.
Stakeholder Communication
Vulnerability reporting audiences vary:
System owners need detailed information about their systems:
- Exact systems affected
- Remediation steps required
- Timeline and dependencies
- Support resources available
Management needs executive summary:
- Number of critical vulnerabilities
- Trend (improving or degrading?)
- Risk to business if vulnerabilities persist
- Budget required to meet remediation SLA
Customers (if the vulnerability affects their services) need:
- Whether they are affected
- When remediation will complete
- Whether their data is at risk
- Steps they should take
Tailoring reports to audience ensures the right information reaches the right people.
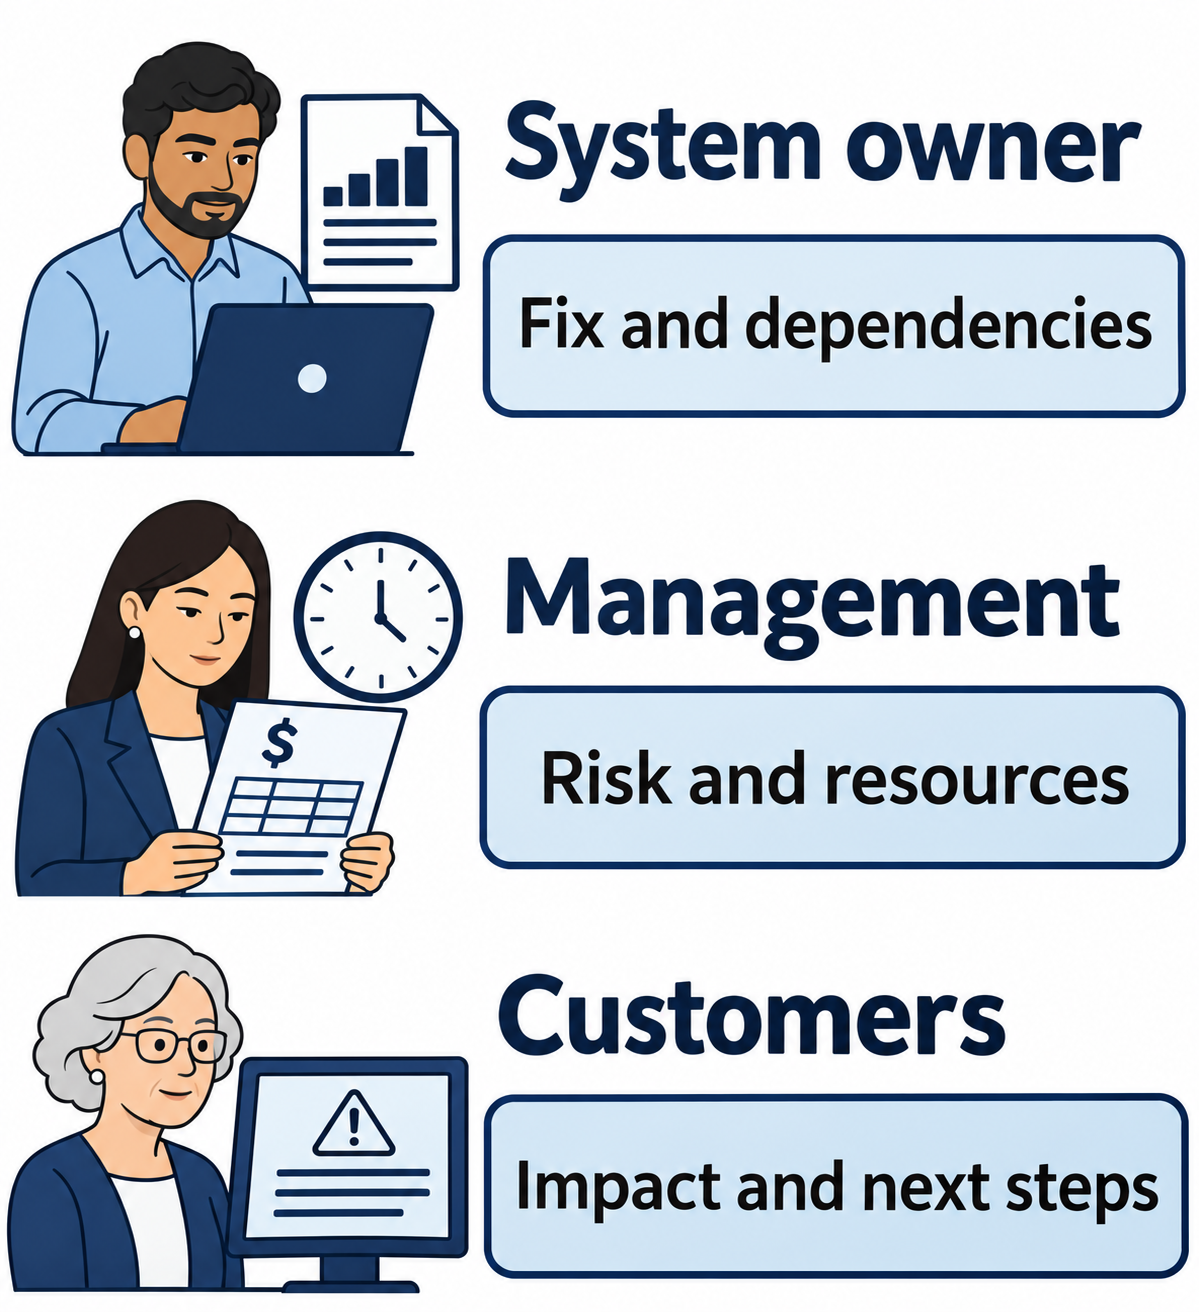
Figure 14.4: Report detail changes with the reader's responsibilities and decisions.
Text description for Figure 14.4
System owners need affected systems, remediation instructions, dependencies, and timing. Management needs the business risk, direction of change, and resources required. Affected customers need a plain-language account of impact and protective steps. Each report draws on the same verified facts.
14.2 Incident Response Reporting
Incident response reporting serves multiple purposes: documenting what happened, enabling response coordination, and creating a record for post-incident analysis and regulatory review.
Incident Declaration and Escalation
Incident declaration is the formal notification that an incident has been detected and response is underway. Declaration includes:
- Incident severity: Critical (immediate impact on operations), High (potential impact), Medium (contained impact), Low (isolated incident with minimal risk).
- Affected systems and users: What is down? How many people are affected?
- Initial impact assessment: What data or systems are at risk?
- Response status: What has been done so far? What is the next step?
- Point of contact: Who is leading the investigation?
- Estimated time to restore: When will services be back online?
Incident severity determines escalation path and communication cadence:
- Critical: CEO, CTO, legal, customer success notified immediately. Daily status calls.
- High: Department heads and customer success notified. Daily updates.
- Medium: Technical team notified. Update after containment.
- Low: Security team handles without external escalation. Email summary after resolution.
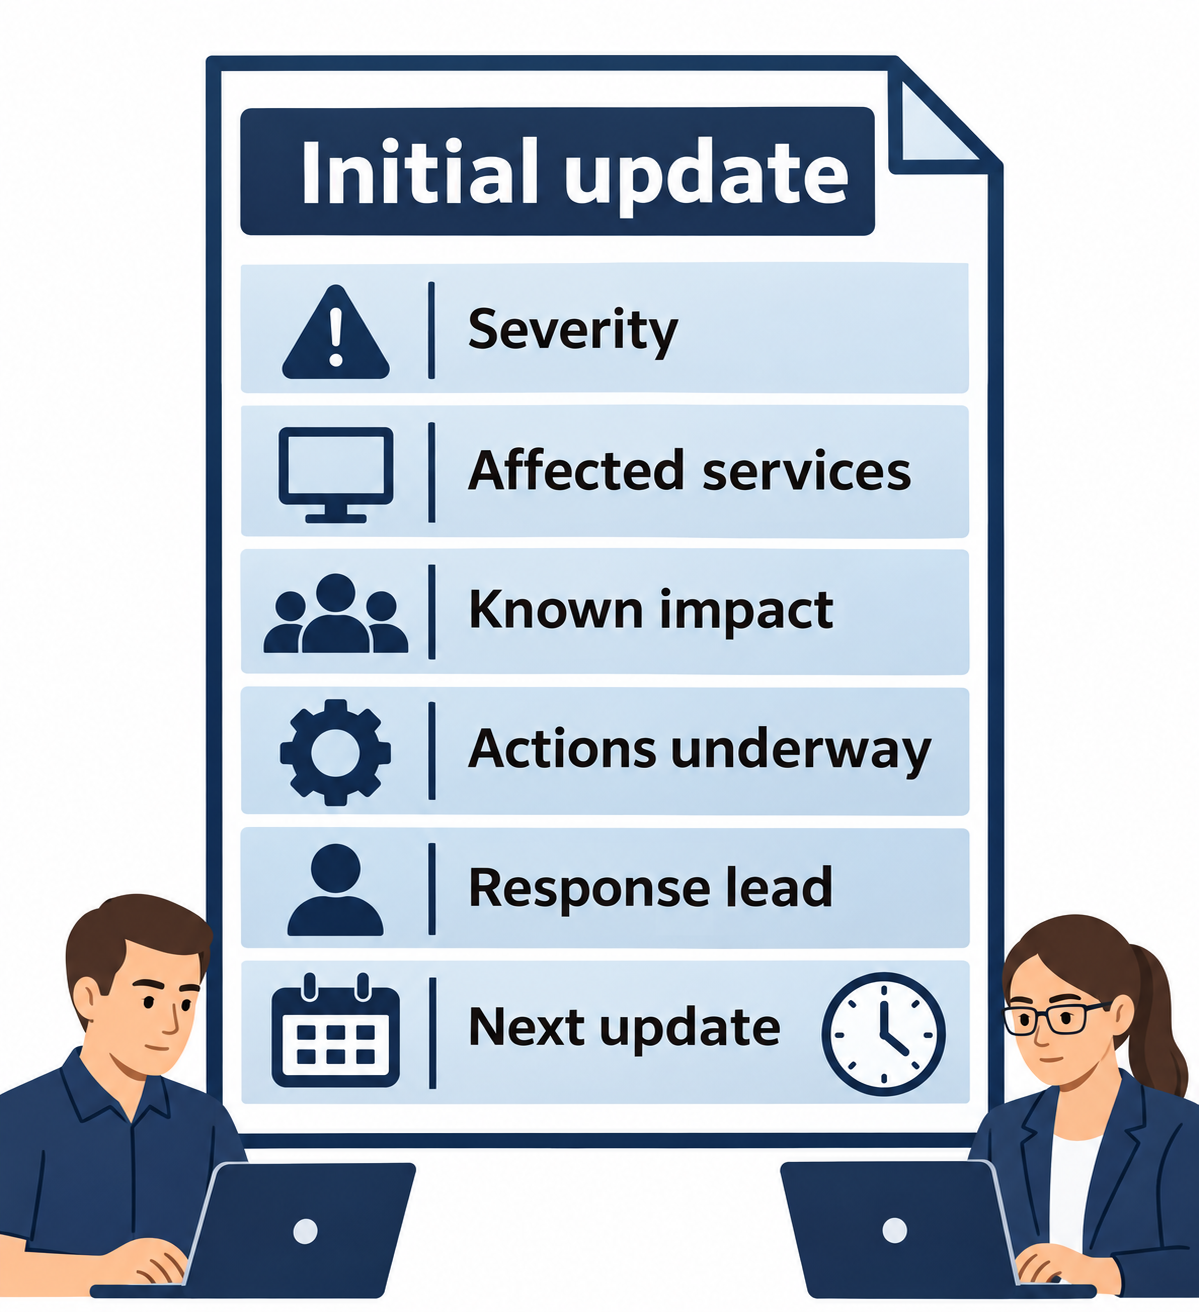
Figure 14.5: An initial incident update gives recipients enough context to coordinate response and expect the next message.
Text description for Figure 14.5
State the assessed severity, affected services, known impact, actions underway, response lead, and planned next update. Mark uncertain scope and restoration estimates as uncertain. Follow the organization's incident plan for recipients, escalation, and update frequency.
Executive Summaries and Technical Findings
An executive summary distills the incident into key findings for non-technical stakeholders:
Incident Summary: Unauthorized Access to Payroll System
On March 5, 2024, at 14:30 UTC, the payroll system experienced unauthorized access. An attacker obtained credentials for a payroll administrator and accessed salary and tax withholding information for 200 employees.
What happened: An employee received a phishing email containing a malicious link. The employee clicked the link, resulting in infection with a trojan that stole their credentials. The attacker then logged in as the employee and moved laterally to the payroll system.
What data is at risk: Employee names, social security numbers, salary information, tax withholding information, and direct deposit account numbers for 200 employees.
Response: Upon detection, we immediately:
- Disconnected the payroll system from the network
- Disabled the compromised employee account
- Initiated forensic investigation
- Notified law enforcement
Timeline to resolution:
- March 5 (detected): Immediate isolation and analysis
- March 6: Confirmation of full scope, notification to affected employees
- March 7: Payroll system brought back online after verification
- March 8-10: Investigation completion, lessons learned documentation
Next steps: Affected employees will be offered credit monitoring. A detailed incident report will be available by March 15.
A technical finding report provides detailed investigation results:
Technical Investigation Report
Timeline of compromise:
- March 4, 14:22 UTC: Employee receives phishing email with subject "Urgent: System Update Required"
- March 4, 14:45 UTC: Employee clicks link in email
- March 4, 14:47 UTC: Trojan (Emotet variant) downloads to employee's workstation
- March 4, 15:00 UTC: Trojan begins keylogging employee's activity
- March 4, 17:15 UTC: Employee logs into payroll system with valid credentials
- March 4, 18:30 UTC: Attacker uses stolen credentials to log in from external IP (1.2.3.4)
- March 4, 19:00 UTC: Attacker accesses payroll database, exports employee records
- March 5, 14:30 UTC: Security team detects unusual data export volume from payroll system, initiates investigation
Systems affected:
- Employee workstation (C-PAYROLL-001): Infected with Emotet trojan
- Payroll system (PAYROLL-PROD): Unauthorized access by attacker using stolen credentials
Artifacts:
- Phishing email headers, domain whois records
- Trojan file hash, behavioral analysis from sandbox (detects as Emotet-ICTY variant)
- Database export logs showing 50,000+ records exported in 10-minute window
- Windows event logs showing attacker logon from external IP
- Firewall logs showing data exfiltration to attacker infrastructure (1.2.3.4:8443)
Attacker actions:
- Initial access via phishing
- Malware deployment and credential theft
- Lateral movement to payroll system using stolen credentials
- Data exfiltration
Root causes:
- Employee lack of phishing awareness (clicked suspicious link)
- No multi-factor authentication on payroll system (stolen password was sufficient)
- Payroll system data export was not logged or monitored
- EDR not deployed to payroll administrator workstations
Recommendations:
- Deploy MFA to payroll system
- Deploy EDR to all administrator workstations
- Implement data loss prevention (DLP) to alert on unusual data exports
- Increase phishing awareness training with focus on payroll impersonation
- Log all database exports with alerting on unusual volumes
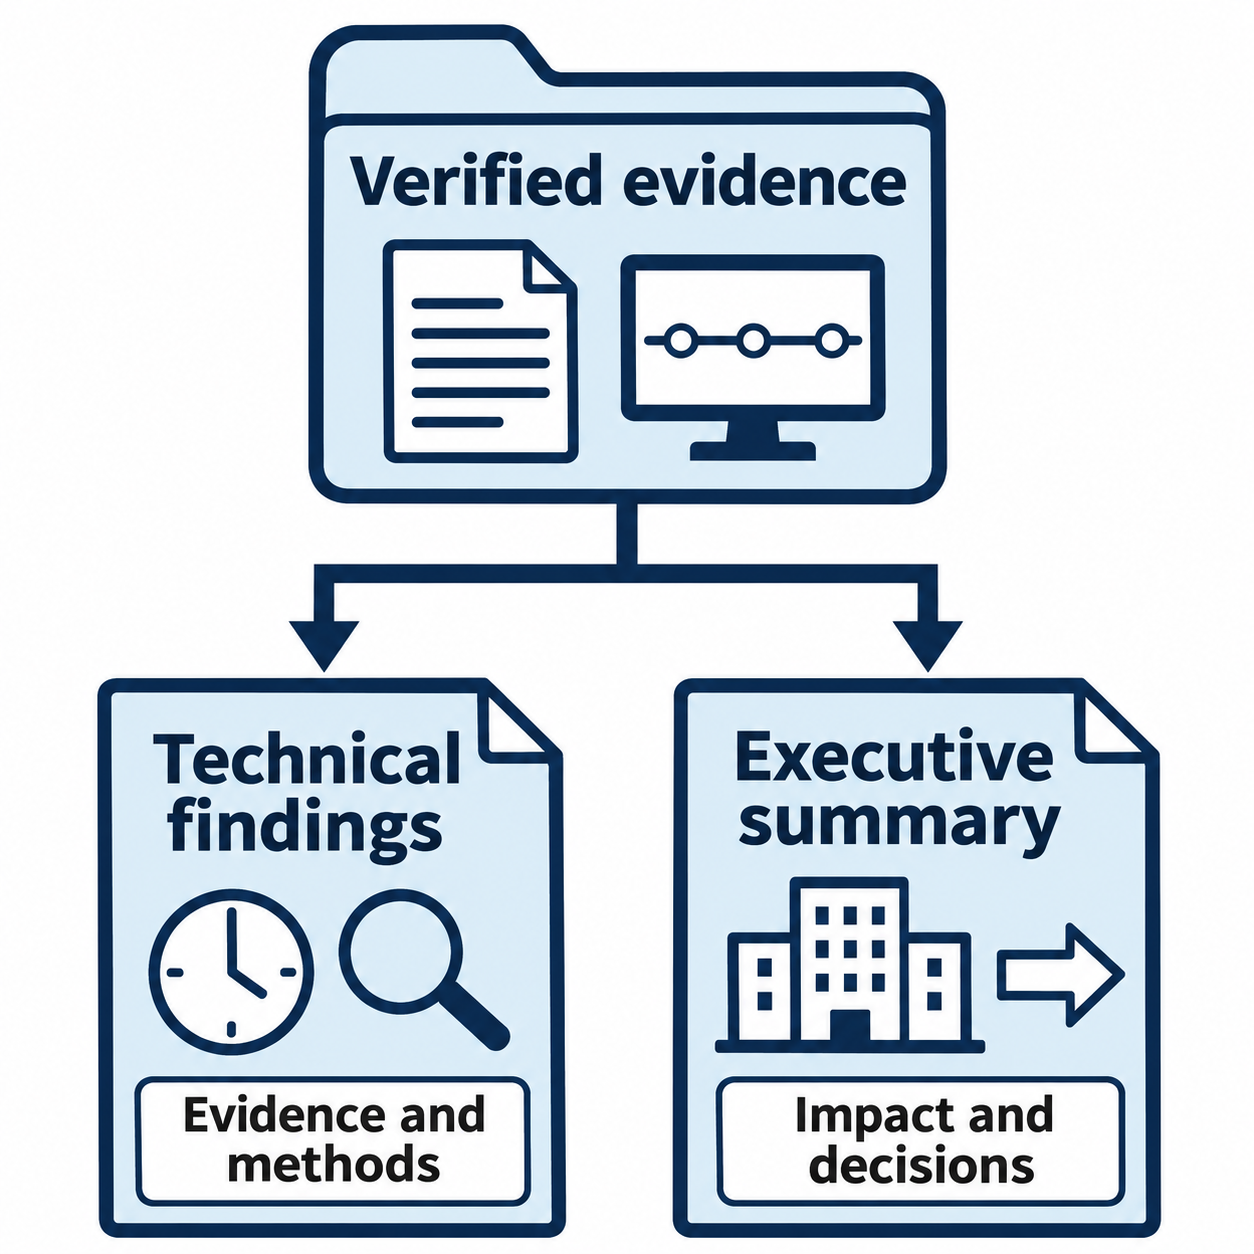
Figure 14.6: Technical findings and executive summaries draw from the same evidence while answering different questions.
Text description for Figure 14.6
The evidence set supports both report types. Technical findings explain the timeline, artifacts, methods, scope, and limitations. The executive summary explains what happened, business impact, response status, and decisions required. Changing the level of detail must preserve the facts and uncertainties.
Regulatory Reporting
Different regulations require different reporting:
HIPAA (Health Insurance Portability and Accountability Act) requires notification of breaches affecting healthcare data:
- Notification to patients whose data was exposed
- Notification to HHS (Department of Health and Human Services)
- Public notification if 500+ individuals are affected
- Timeline: 60 days
GDPR (General Data Protection Regulation) requires notification of data breaches affecting European residents:
- Notification to data protection authority
- Notification to affected individuals (in some cases)
- Timeline: 72 hours
California Consumer Privacy Act (CCPA) requires notification of breaches affecting California residents:
- Notification to affected residents
- Notification to California Attorney General (if 500+ residents)
- Timeline: Without unreasonable delay
PCI DSS (Payment Card Industry Data Security Standard) requires notification if payment card data is breached:
- Notification to payment card networks (Visa, Mastercard, etc.)
- Investigation and remediation requirements
- Fines and penalties for non-compliance
Understanding regulatory requirements ensures compliance and avoids penalties. Many organizations engage legal counsel to draft regulatory notifications.
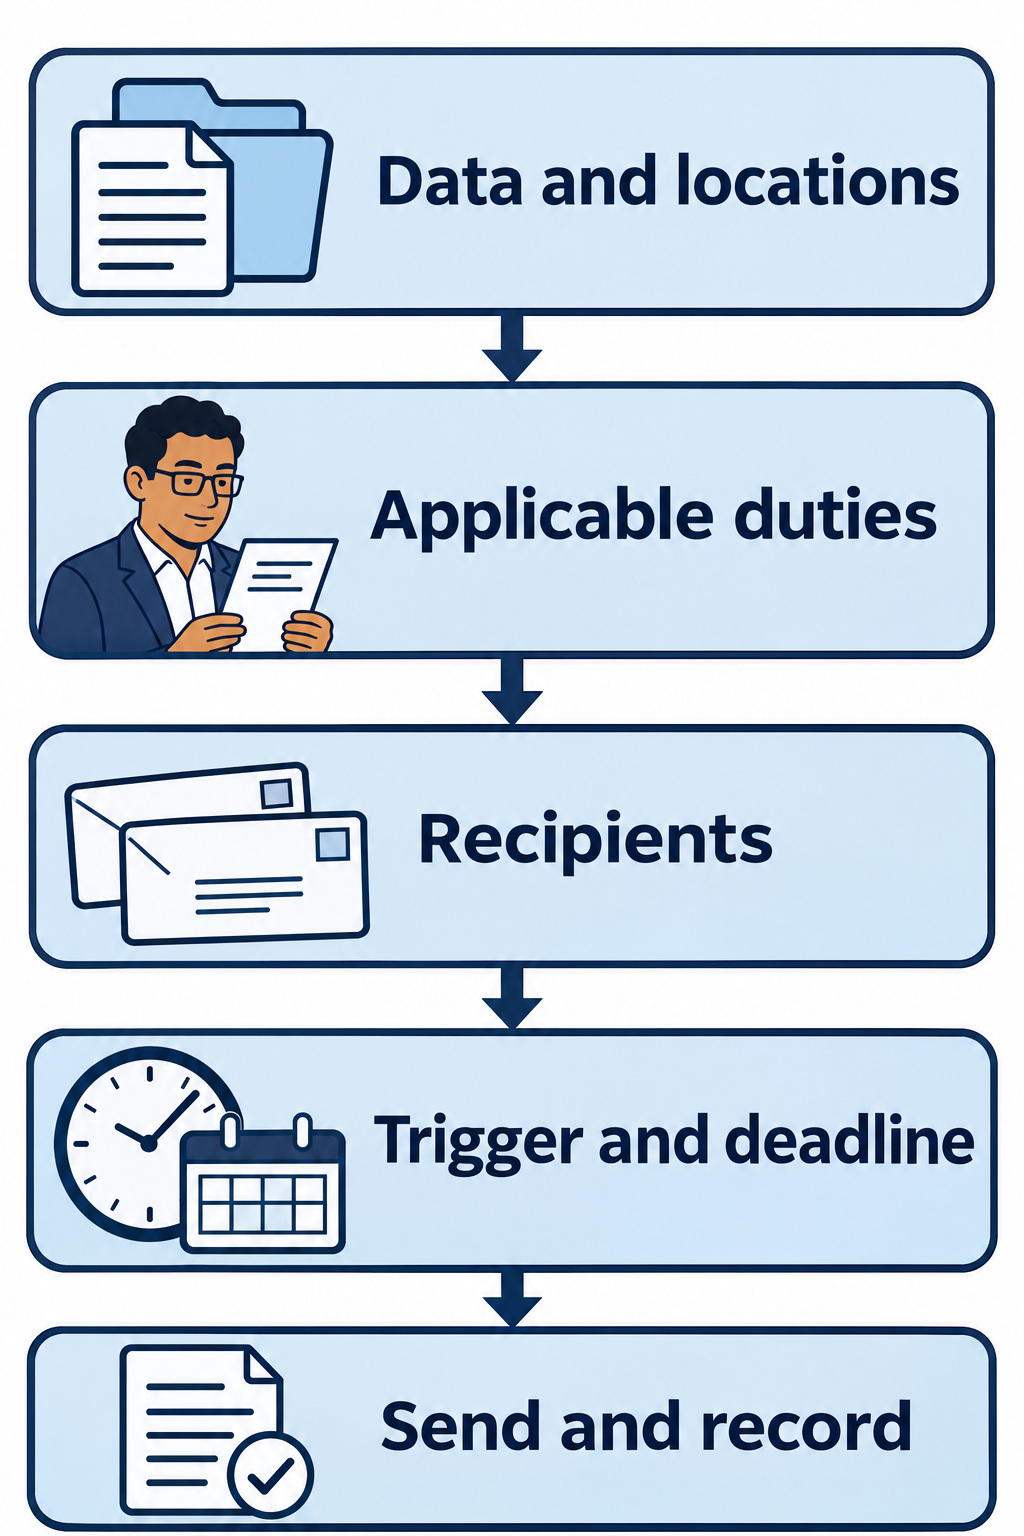
Figure 14.7: Notification planning connects incident facts to the recipients, timing, and records required by applicable duties.
Text description for Figure 14.7
Identify the affected data, people, locations, and organizational role. Legal and privacy staff determine applicable statutory, regulatory, and contractual duties, including recipients and the event that starts each deadline. Coordinate the message and record notifications. This conceptual workflow does not specify legal deadlines, and review does not pause an applicable notification clock.
14.3 Post-Incident Reporting and Lessons Learned
After an incident is resolved, teams must document and communicate findings to prevent recurrence.
After-Action Reports
An after-action report (AAR) documents what happened, what was done well, and what could be improved. AARs are conducted 1-2 weeks after incident resolution, allowing time for detailed investigation and reflection.
AAR structure:
-
Incident summary: What was the incident? When was it detected? When was it resolved?
-
Timeline: Minute-by-minute reconstruction of the incident from attacker's initial access through resolution.
-
What went well:
- EDR detected malware within 5 minutes of execution
- Incident response team assembled within 15 minutes
- Affected system was isolated within 30 minutes
- Forensic investigation was thorough and comprehensive
-
What could be improved:
- Detection delay: Malware persisted for 4 hours before EDR alert
- Response speed: First response took 15 minutes; SLA is 10 minutes
- Artifact preservation: Some log files were overwritten before collection
- Communication: Customer notification took 6 hours; should be 2 hours
-
Root causes:
- EDR alert tuning resulted in delayed detection
- On-call team member was in a meeting when alert fired
- Forensic procedures were not clearly documented
-
Lessons learned and action items:
| Lesson | Root Cause | Action Item | Owner | Target Date |
|---|---|---|---|---|
| EDR detection delayed by 4 hours | Alert tuning too aggressive | Review and retune EDR alerting for malware behavior | SOC Manager | 2024-04-05 |
| Response time exceeded SLA | On-call team member unavailable | Implement backup on-call rotation to ensure coverage | Manager | 2024-03-30 |
| Log files overwritten during forensics | No procedure for immediate log preservation | Document and implement immediate log preservation procedures | CISO | 2024-03-25 |
| Customer notification delayed | No pre-drafted notification template | Create communication templates for common incident types | Communications | 2024-04-10 |
AARs are not blame-focused; they are process-focused. The goal is to identify systemic improvements, not to find scapegoats.
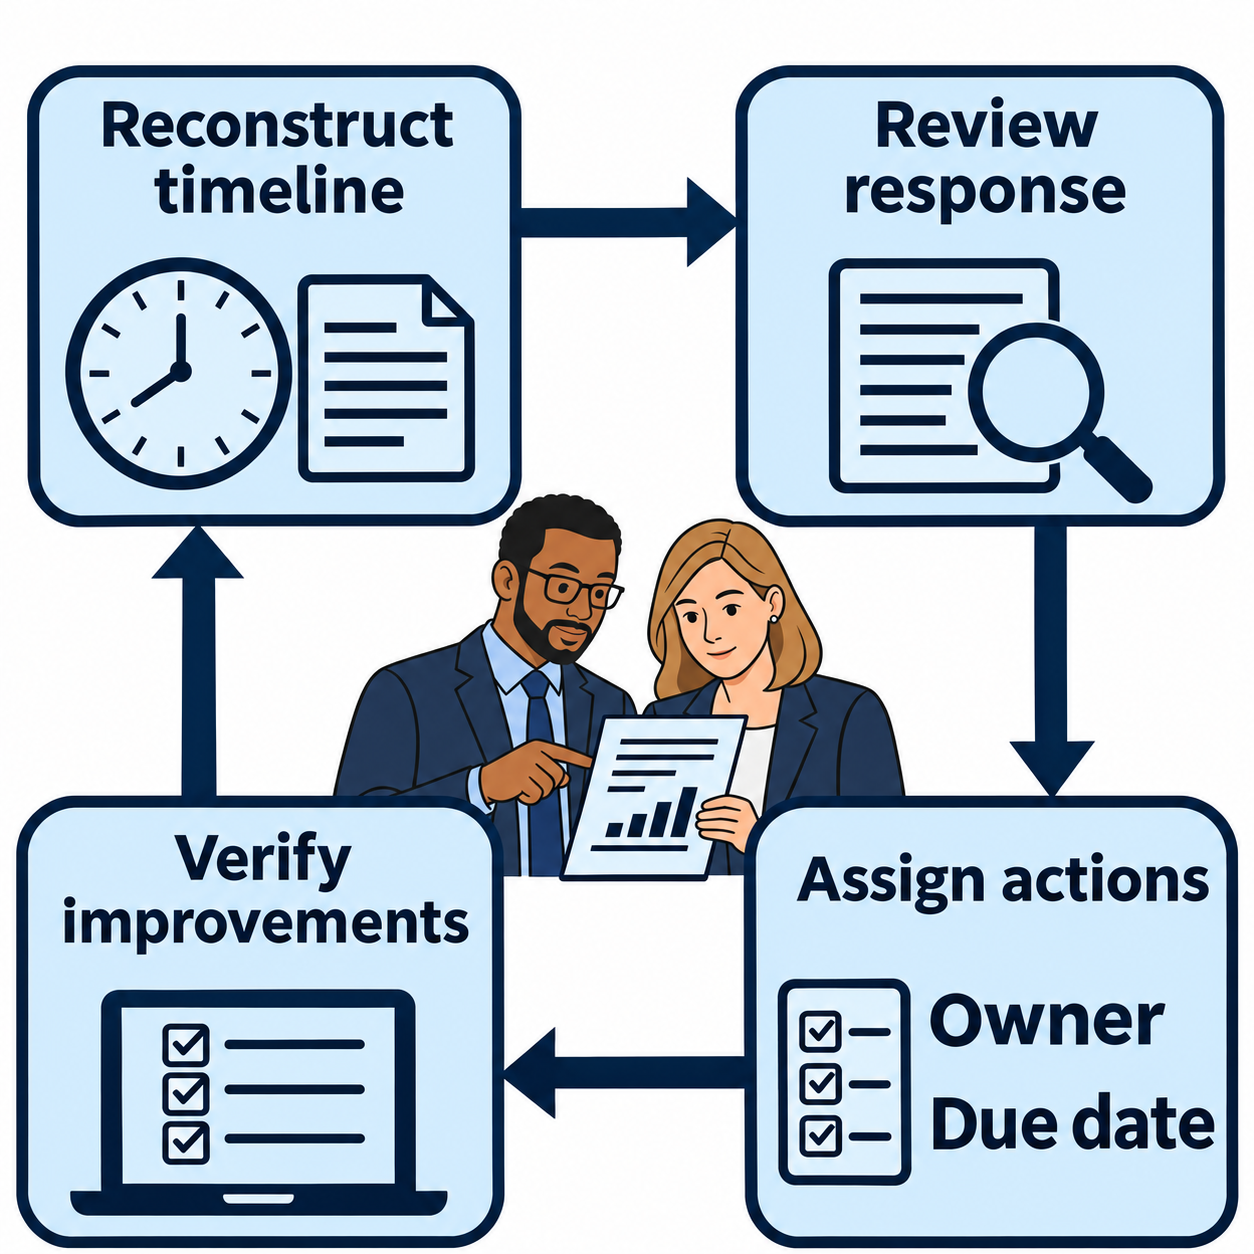
Figure 14.8: An after-action report supports improvement when assigned actions lead to verified changes.
Text description for Figure 14.8
Reconstruct events from evidence, review what worked and what needs improvement, and record corrective actions. Give each action an owner and due date. Check completion and effectiveness, then feed the results into future response practices. Review schedules depend on the incident and the organization's process.
Root Cause Analysis
Root cause analysis goes deeper than post-incident findings to answer: "Why did the vulnerability exist? Why was it not detected? Why was response delayed?"
Root causes often involve organizational factors, not just technical factors:
- Lack of training: Employees were not trained on phishing indicators
- Lack of tools: EDR was not deployed due to budget constraints
- Lack of process: No procedure for immediate incident notification
- Competing priorities: Patching was delayed because development requests took priority
Identifying root causes enables systemic improvement.
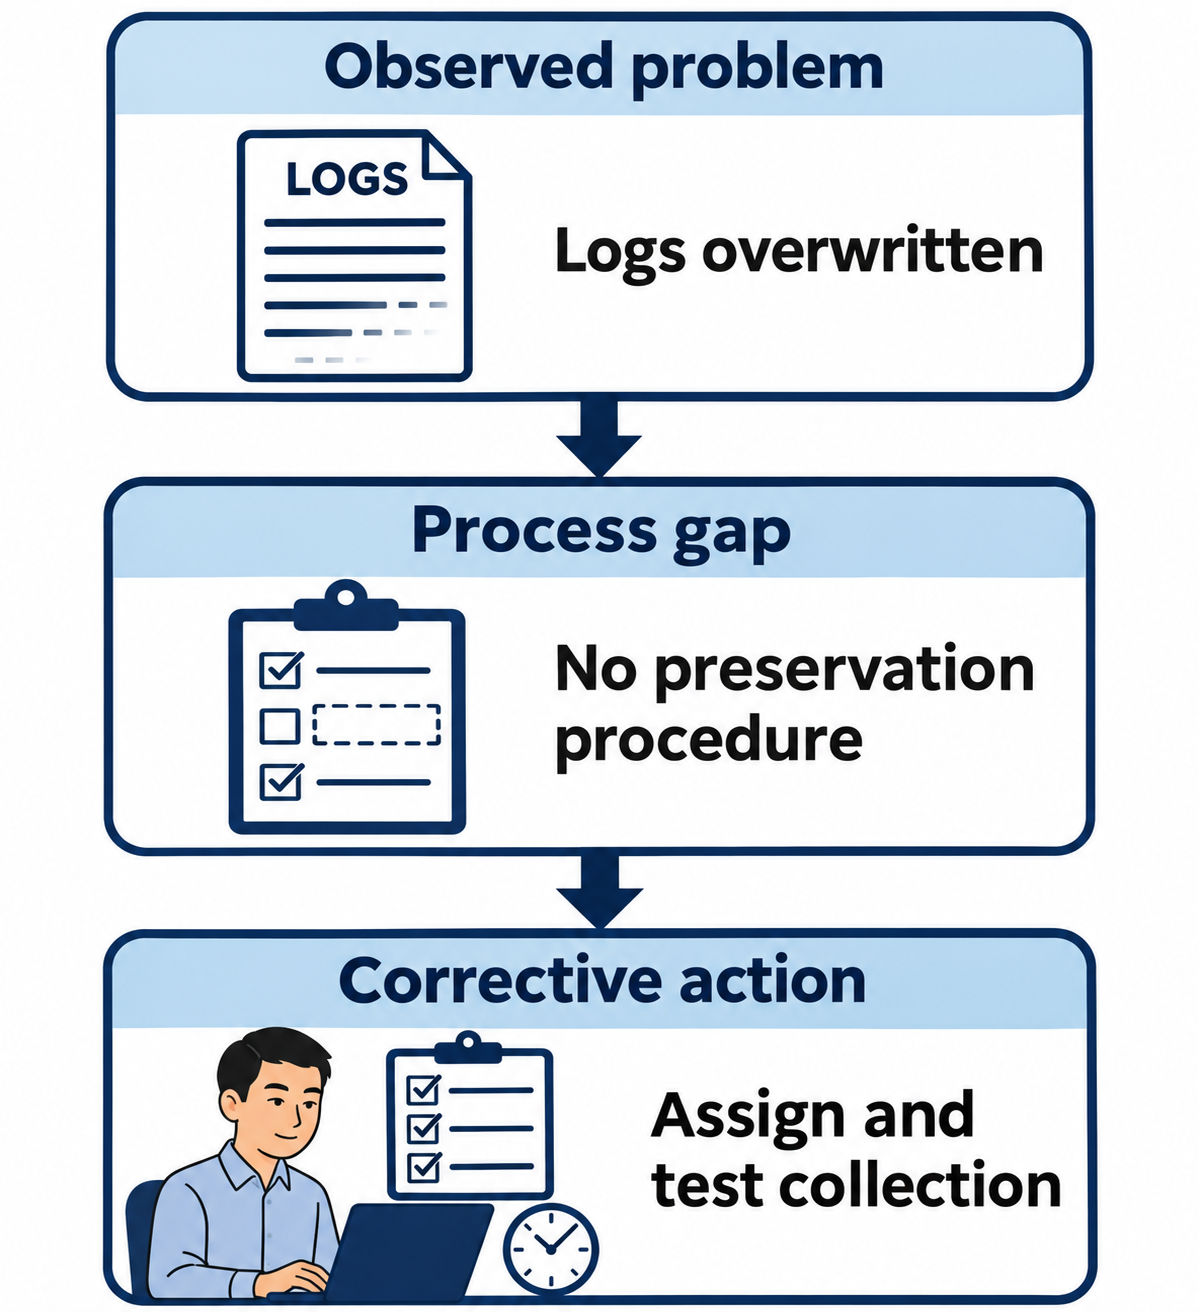
Figure 14.9: Root cause analysis links an observed evidence loss to a process gap and a testable corrective action.
Text description for Figure 14.9
This illustrative causal chain begins with overwritten logs. The review identifies a missing immediate-preservation procedure as a contributing process gap. The action assigns responsibility and tests timely collection. A real investigation must support causal conclusions with evidence and may identify several contributing causes.
Communicating Lessons Learned
Lessons learned must be communicated to:
- Incident response team: Ensuring team members are aware of improvements and understand the rationale.
- Related teams: If the lesson involves patching improvements, communicate with operations. If it involves email security, communicate with email team.
- Management: Demonstrating that incidents drive continuous improvement and requesting resources to implement improvements.
- All staff: If the lesson involves phishing awareness, conduct refresher training.
Lessons learned that are not communicated and acted upon provide no value. Communication ensures improvements are implemented.
14.4 Security Metrics and KPIs
Effective security reporting is data-driven. Security metrics and key performance indicators (KPIs) provide concrete evidence of program effectiveness.
Vulnerability Management Metrics
| Metric | Definition | Target | Frequency |
|---|---|---|---|
| Critical vulnerabilities patched | Percentage of critical vulnerabilities patched within SLA | 95% | Monthly |
| High vulnerabilities patched | Percentage of high vulnerabilities patched within SLA | 90% | Monthly |
| Mean time to remediate | Average time from discovery to remediation | 15 days | Monthly |
| Vulnerability discovery rate | New vulnerabilities discovered per month | Trending flat or down | Monthly |
Incident Response Metrics
| Metric | Definition | Target | Frequency |
|---|---|---|---|
| MTTD (Mean Time to Detect) | Average time from attack initiation to detection | < 12 hours | Quarterly |
| MTTC (Mean Time to Contain) | Average time from detection to containment | < 4 hours | Quarterly |
| MTTR (Mean Time to Remediate) | Average time from detection to complete resolution | < 72 hours | Quarterly |
| Alert fatigue / False positive rate | Percentage of alerts that are false positives | < 20% | Monthly |
| True positive rate | Percentage of attacks that are detected | Increasing trend | Quarterly |
| Incidents by severity | Distribution of detected incidents by severity | Few critical, more low | Quarterly |
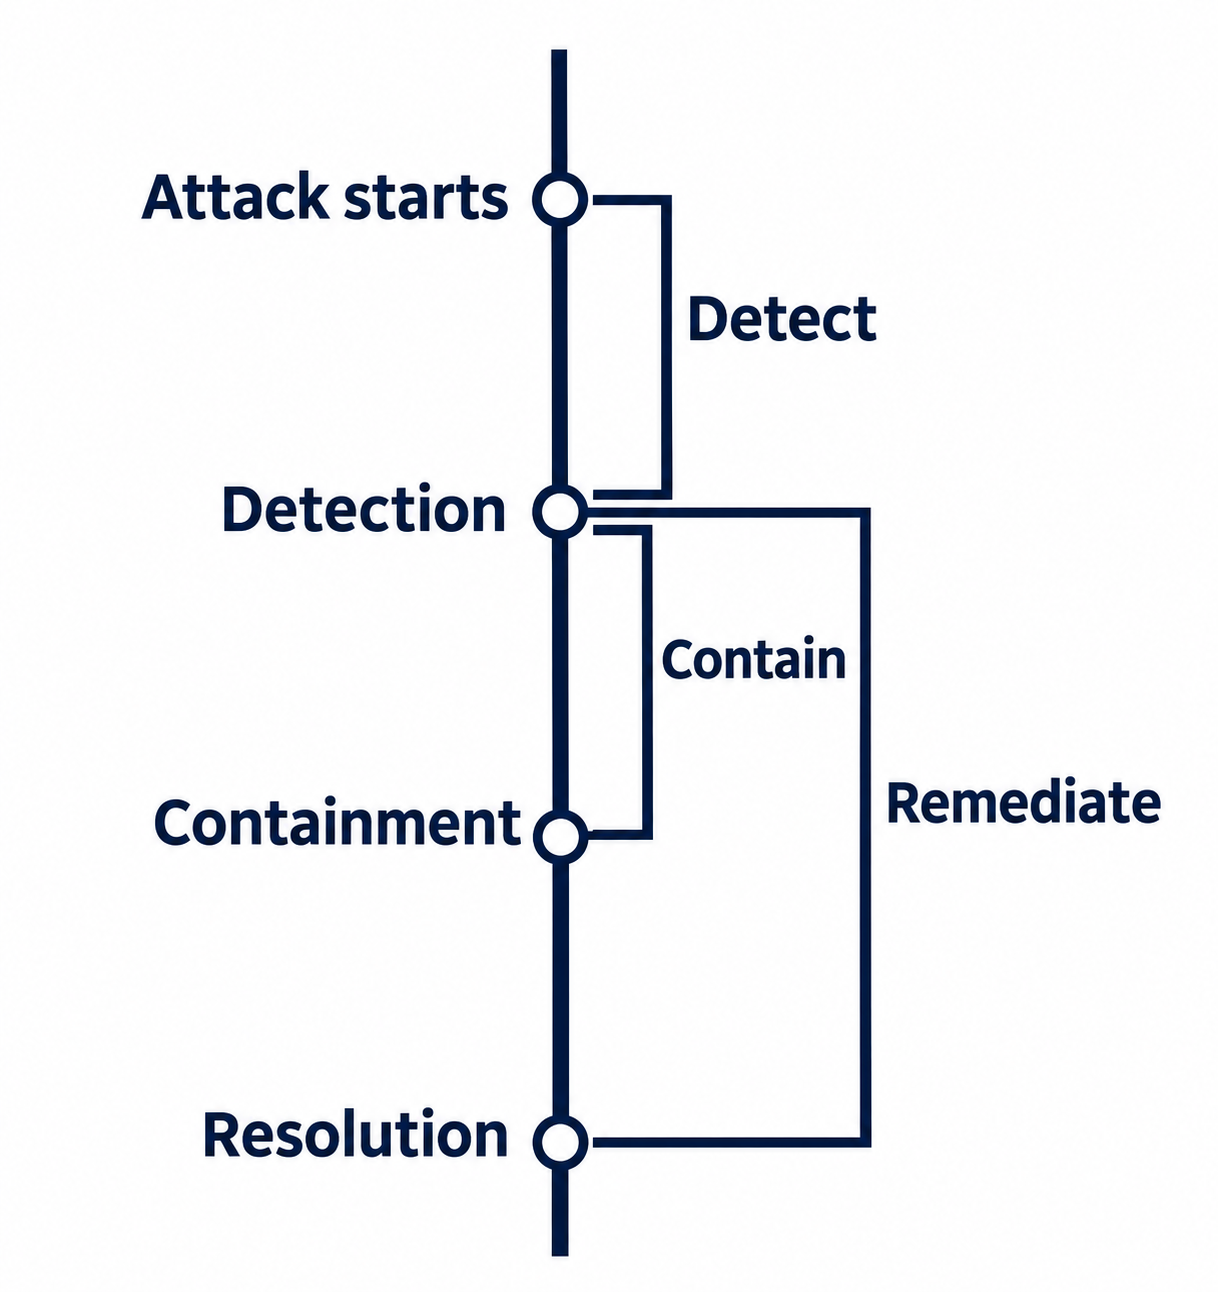
Figure 14.10: Response-time measures require explicit starting and ending events.
Open Figure 14.10 at full size
Text description for Figure 14.10
Using this chapter's definitions, detection time begins at attack initiation and ends at detection. Containment time begins at detection and ends at containment. Remediation time begins at detection and ends at complete resolution. Mean time to detect (MTTD), mean time to contain (MTTC), and mean time to remediate (MTTR) average the corresponding intervals across a defined incident set. Specify timestamps, scope, and any estimated attack-start times.
Email and Phishing Metrics
| Metric | Definition | Target | Frequency |
|---|---|---|---|
| Phishing click rate | Percentage of employees who click phishing links in simulations | < 5% | Quarterly |
| Phishing report rate | Percentage of employees who report phishing to security | Increasing | Quarterly |
| Malware blocked at email gateway | Number and percentage of emails with malware blocked | > 99% | Daily |
| Email authentication (SPF/DKIM/DMARC) | Percentage of inbound emails passing authentication | > 90% | Monthly |
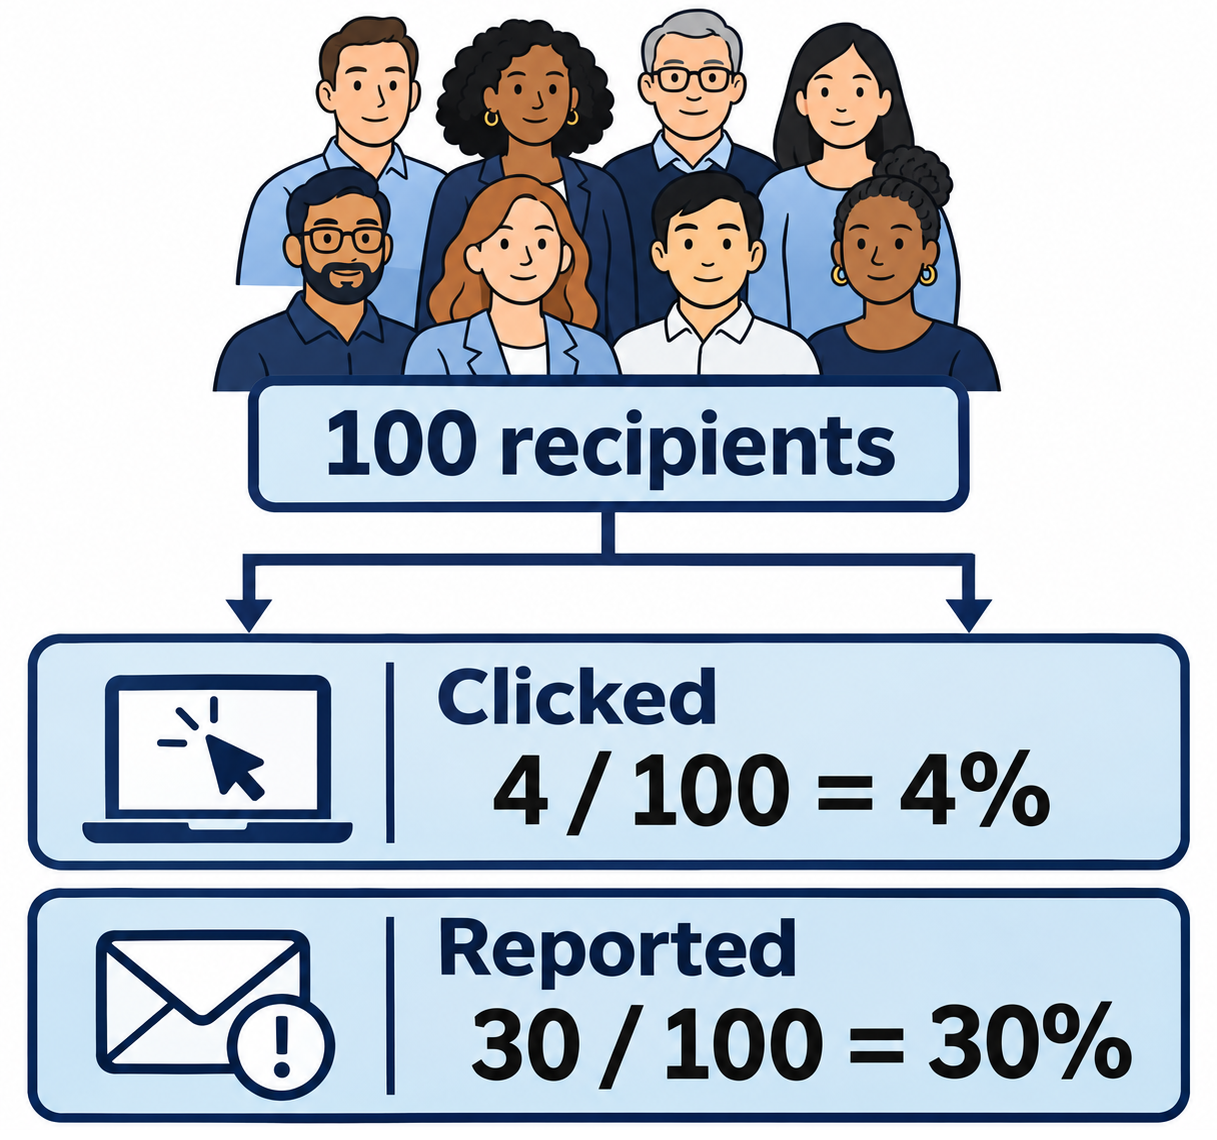
Figure 14.11: A synthetic phishing exercise illustrates why percentages need a defined denominator.
Open Figure 14.11 at full size
Text description for Figure 14.11
Both rates use the same 100 recipients and observation period. Four recipients clicked, so the click rate is 4%. Thirty recipients reported, so the report rate is 30%. These groups can overlap. State whether the denominator counts recipients, delivered messages, or another defined population before comparing exercises.
Executive Dashboards
Executive dashboards present key metrics in visual format, highlighting trends and status:
Security Metrics Dashboard - Q1 2024

Critical Vulnerabilities Patched: 92% (Target: 95%)
  Status: Underperforming - Action required

Mean Time to Detect Incidents: 18 hours (Target: 12 hours)
  Status: Underperforming - Increasing EDR tuning priority

Employee Phishing Click Rate: 4% (Target: < 5%)
  Status: On target - Continue training program

MTTR (Mean Time to Remediate): 60 hours (Target: 72 hours)
  Status: Exceeding target - Excellent response

Incidents by Severity:
  Critical: 2 (1 resolved, 1 ongoing)
  High: 8 (all resolved)
  Medium: 24 (all resolved)
  Low: 156 (all resolved)

Top risks this quarter:
1. Email authentication gaps (5% of inbound mail fails DMARC)
2. Unpatched legacy systems (3 critical, no patch available)
3. Phishing targeting finance department
Dashboards are reviewed by leadership monthly or quarterly to assess security posture and inform resource allocation.
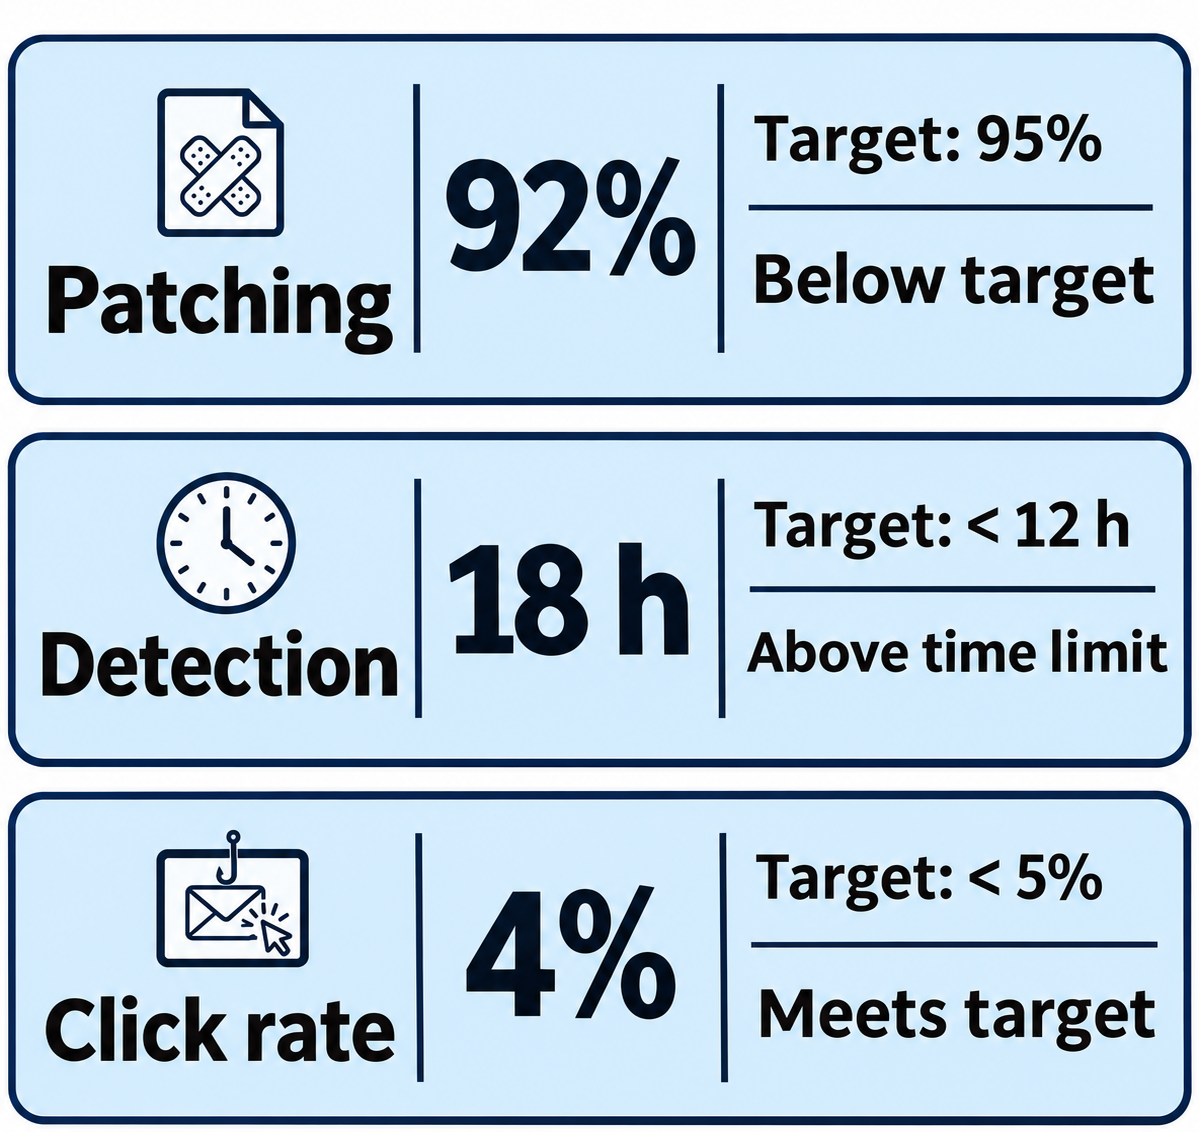
Figure 14.12: A useful dashboard pairs each measured value with a target and a status that reflects the direction of improvement.
Open Figure 14.12 at full size
Text description for Figure 14.12
These illustrative values come from the chapter's dashboard example. Critical patching reaches 92%, below its 95% target. Mean detection time reaches 18 hours, above the target of less than 12 hours. The phishing click rate is 4%, meeting the target of less than 5%. Higher is desirable for patch completion; lower is desirable for these time and click measures. Targets are organizational examples.
14.5 Putting It Together: Target Breach (2013) and Equifax Breach (2017)
Target Breach (2013): Communication Failures
Incident: Attackers compromised Target's payment card processing system, stealing credit card numbers for 40 million customers and personal information for 70 million customers.
Timeline:
- November 27, 2013: Initial compromise. Attackers gain access through a third-party vendor (HVAC company) with network access to Target.
- December 2-3: Attackers deploy malware on checkout systems.
- December 15: Security researchers alert Target to suspicious activity.
- December 18: Target acknowledges breach publicly.
- December 22: Initial scope estimate (40 million card numbers).
- January 2014: Scope expanded to 70 million customers (personal information).
Communication failures:
-
Delayed detection: Security researchers discovered the breach; Target's own detection systems did not. Three weeks of unauthorized access.
-
Inadequate initial disclosure: Target initially stated "fewer than 40 million" card numbers were stolen, then increased the estimate.
-
Lack of transparency: Target did not initially disclose what personal information was stolen, forcing customers to speculate.
-
Inadequate guidance to customers: Target offered only one year of free credit monitoring, which many customers found insufficient.
-
Regulatory friction: Lawsuits, regulatory investigations, and fines followed years of litigation.
Lessons:
- Early, transparent communication builds trust. Delayed communication and scope underestimation erodes customer trust.
- Customers deserve clear guidance on what data was stolen and what steps to take.
- Third-party vendor management is critical; third-party compromise can be as damaging as direct compromise.
Equifax Breach (2017): Regulatory Compliance Failures
Incident: Equifax, a major credit reporting agency, suffered a breach exposing personal information for 147 million people, including social security numbers.
Timeline:
- March-April 2017: Equifax is notified of a vulnerability (CVE-2017-5638) in Apache Struts.
- May-July 2017: Attackers exploit the vulnerability, gaining access to Equifax systems. Breach continues undetected for months.
- July 29, 2017: Equifax discovers the breach.
- September 7, 2017: Equifax announces the breach publicly.
- January 2018: Equifax provides a free credit monitoring service to victims (though only after significant pressure).
- July 2019: Equifax announces a $700 million settlement with the Federal Trade Commission.
Communication and compliance failures:
-
Delayed notification: Equifax took more than one month from discovering the breach to publicly announcing it. Customers were left in the dark.
-
Inadequate customer guidance: Initially, Equifax did not clearly explain what information was stolen. The company pushed customers to use its own credit monitoring service (which had mixed reviews).
-
Regulatory non-compliance: FCRA requires credit reporting agencies to take reasonable steps to protect personal information. Equifax's security was deemed inadequate (unpatched systems, poor segmentation, weak monitoring).
-
Reputational damage: The breach damaged Equifax's credibility. Customers questioned why they were relying on a company that could not protect their data.
Lessons:
- Regulatory requirements for notification are not optional. Delayed notification invites investigation and penalties.
- Major breaches of sensitive data deserve prompt, transparent communication.
- Offering quality customer protection (credit monitoring) is a responsibility.
- Security failures cascade into regulatory penalties, lawsuits, and loss of customer trust.
14.6 Communication Best Practices
Effective security reporting follows consistent principles:
Clarity and Accuracy
- Use clear language. Avoid jargon unless it is defined.
- Provide context. "A vulnerability allows remote code execution" is vague. "A vulnerability in Apache Struts allows an unauthenticated attacker to execute arbitrary code on web servers" is clear.
- Cite sources. "25 million customer records were breached" requires evidence. Cite forensic analysis, log data, or law enforcement estimates.
Timeliness
- Communicate quickly. Delayed communication appears evasive.
- Set expectations. If full investigation takes time, communicate initial findings and provide an update schedule.
- Proactive beats reactive. Communicate findings before external sources do.
Audience-appropriate Format
- Technical audience: Detailed technical reports, IOCs, malware analysis.
- Management: Executive summaries, business impact, resource requirements.
- Customers: Plain language, clear impact statement, protection steps.
- Regulators: Regulatory-required formats, legal review.
Actionable Information
- Reports should lead to action. "Three critical vulnerabilities exist on servers X, Y, Z, requiring patches version 4.2 or later by March 31."
- Avoid abstract findings. "Security posture could be improved" is not actionable. "Implement multi-factor authentication for administrative accounts, targeting completion by Q2" is actionable.
Accountability and Follow-up
- Assign owners. "The infrastructure team will patch servers X and Y by March 31."
- Track progress. Report status weekly until complete.
- Close the loop. Communicate completion and verification.
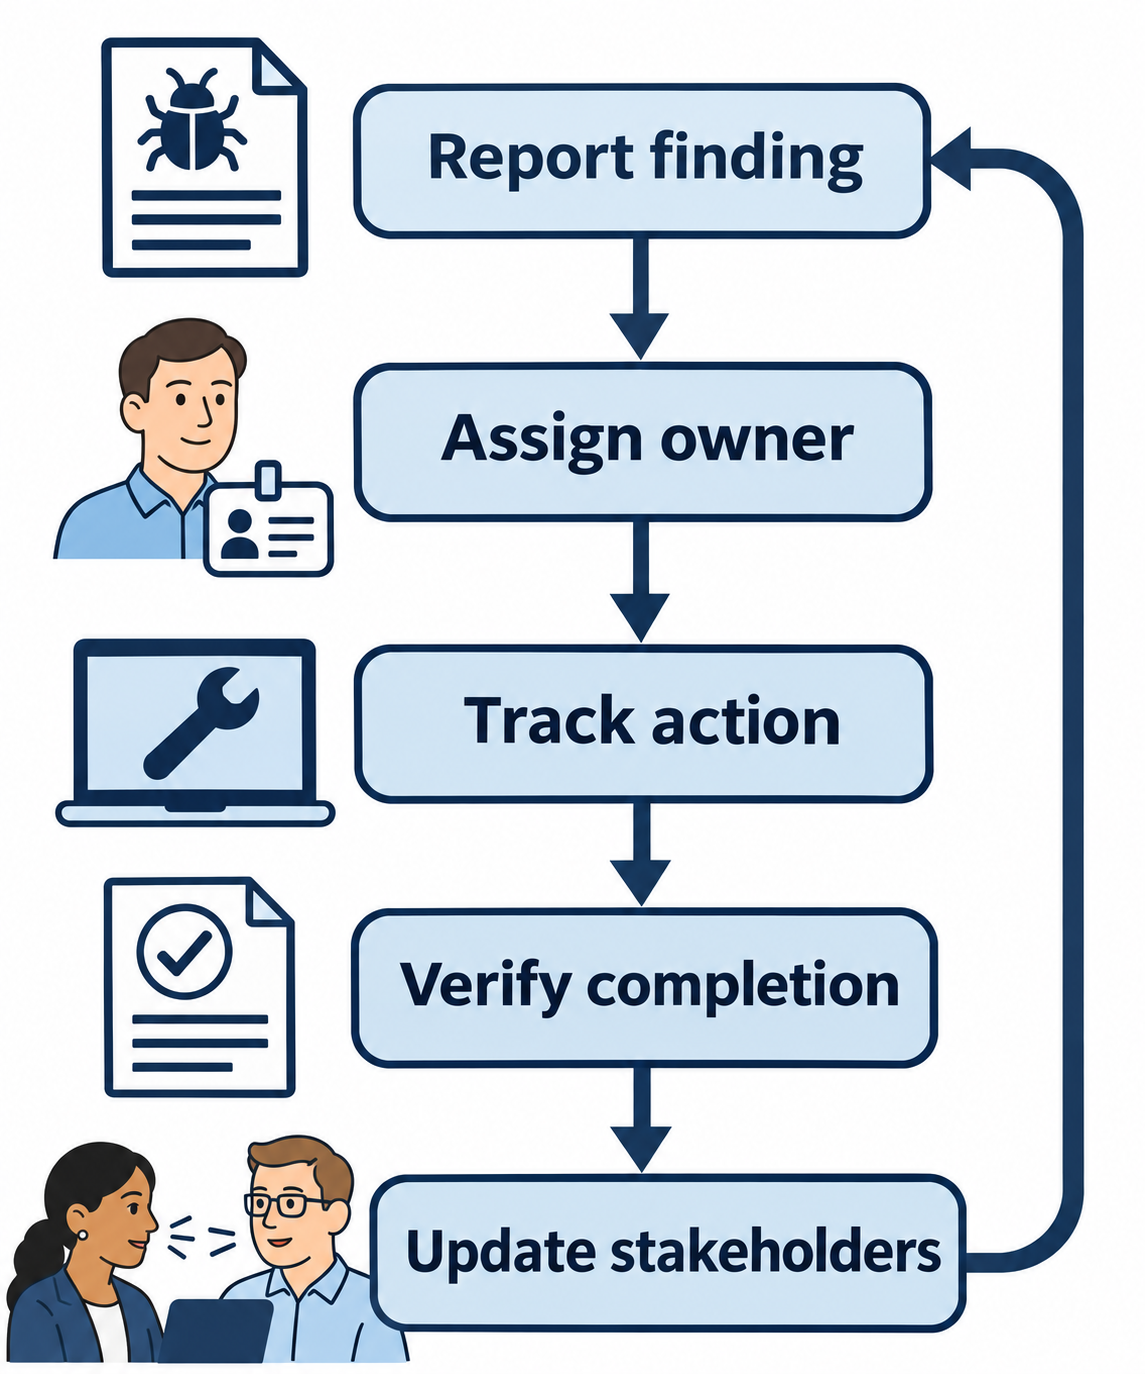
Figure 14.13: Accountable communication follows a finding through action, verification, and an updated stakeholder message.
Open Figure 14.13 at full size
Text description for Figure 14.13
Describe the finding and the required response. Assign an owner, agree on a due date, and track progress. Verify that the completed action addresses the finding, then communicate the result to stakeholders. If verification reveals remaining work, update the record and continue follow-up.
Chapter Summary
-
Vulnerability reporting distills thousands of findings into actionable priorities. Risk scorecards highlight critical vulnerabilities, document remediation paths, and set target dates.
-
Inhibitor documentation acknowledges legitimate reasons for delayed remediation (vendor delay, legacy systems, business interruption) while setting timelines for resolution.
-
Incident reporting serves multiple audiences: technical teams need detailed findings, management needs executive summaries, customers need plain-language impact statements, and regulators need compliance-required formats.
-
After-action reports document lessons learned and drive continuous improvement. Root cause analysis identifies systemic issues, not just technical problems.
-
Metrics (MTTD, MTTC, MTTR, vulnerability patching rates) provide concrete evidence of program effectiveness and identify areas for improvement.
-
Target breach demonstrates how delayed detection and inadequate communication erode customer trust.
-
Equifax breach demonstrates how regulatory non-compliance and data protection failures lead to massive fines, lawsuits, and reputational damage.
-
Best practices: Clarity, timeliness, audience-appropriate format, actionable information, and accountability.