CH11: Security Operations Tools: Threat Intel Platforms, Endpoint Security, File Analysis, and Scripting
Introduction
A security operations center (SOC) is defined by its tools. While human expertise and judgment are irreplaceable, the volume and velocity of modern threats demands automation, integration, and intelligent filtering. A SOC analyst handling thousands of daily alerts cannot investigate each one manually. Instead, the analyst relies on a coordinated suite of tools that collect indicators from external sources, correlate them with internal telemetry, isolate endpoints automatically, analyze suspicious files in sandboxed environments, and execute remediation playbooks through code.
This chapter surveys the operational toolkit that turns detection into action. Threat intelligence platforms aggregate indicators from open-source feeds, commercial vendors, and internal analysis to contextualize what is happening inside the network. Endpoint detection and response (EDR) tools capture process execution, file writes, and network activity at the endpoint, providing visibility where network tools are blind. File analysis tools identify malware through signature matching, behavioral analysis, and dynamic sandboxing. User and Entity Behavior Analytics (UEBA) detects when accounts or systems deviate from baseline. Scripting and automation connect these tools through APIs and reduce manual toil.
By the end of this chapter, you will understand how to select, integrate, and operationalize these tools to accelerate incident response and hunt for threats before they cause damage.
Learning Objectives
Upon completing this chapter, students will be able to:
- Navigate threat intelligence platforms (OTX, MISP, OpenCTI) to research IOCs and construct threat profiles.
- Deploy and configure endpoint detection and response (EDR) tools, understand their data streams, and triage endpoint alerts.
- Employ file analysis tools (VirusTotal, YARA, strings) to characterize unknown files and identify malware.
- Execute command-line and scripting tasks (shell script, PowerShell, Python) to automate analysis and response workflows.
- Evaluate domain reputation, IP geolocation, and email metadata to validate indicators and assess risk.
11.1 Threat Intelligence Platforms and IOC Research
Threat intelligence has moved from static reports published quarterly to dynamic feeds updated in real-time. A threat intelligence platform (TIP) is a centralized system that collects indicators of compromise (IOCs), threat actor profiles, attack methodologies, and vulnerability disclosures from hundreds of sources and makes them searchable and actionable.
Alienvault OTX (Open Threat Exchange)
AlienVault OTX is a free, community-driven threat intelligence platform where researchers publish indicators and threat analyses. It requires free registration.
OTX structure:
- Pulses: Curated collections of IOCs organized by threat actor, malware family, or campaign. A pulse on the Emotet botnet might contain hundreds of malicious IP addresses, domain names, and file hashes associated with that campaign.
- IOC types: Domains, IPv4/IPv6 addresses, email addresses, file hashes (MD5, SHA1, SHA256), URLs, file names, CIDR blocks.
- User contributions: Researchers contribute pulses based on their investigations. A SOC team can subscribe to specific threat actor pulses and receive alerts when their infrastructure interacts with those indicators.
- Search and correlation: The analyst can search for a specific indicator (IP address, domain, file hash) and immediately see which pulses reference it and what additional related indicators exist.
OTX integrates with endpoint and network tools through APIs and webhook integrations. When a Suricata alert fires with a malicious IP address, the alert can automatically query OTX in real-time to enrich the alert with threat actor profile, known attack patterns, and related IOCs.
Analyst Perspective
OTX is free and widely used, making it a good starting point for threat intelligence. However, it relies on community contributions, which vary in quality and timeliness. For critical investigations, cross-reference OTX findings with commercial feeds (Mandiant, Proofpoint, CrowdStrike) which have full-time analysts and faster detection.
MISP (Malware Information Sharing Platform)
MISP is an open-source threat intelligence platform designed for organized information sharing within organizations and between trusted partners. Installed and operated on-premises, MISP provides fine-grained access control, allowing organizations to share indicators selectively with partner organizations while keeping sensitive internal data private.
MISP fundamentals:
- Events: MISP organizes IOCs into events, each representing a specific incident, campaign, or threat discovery. An event on the SolarWinds supply-chain compromise would contain all indicators related to that campaign.
- Attributes: IOCs within an event. A domain name is an attribute; a file hash is an attribute.
- Object relationships: MISP allows defining relationships between attributes (e.g., "this file hash is associated with this domain," "this IP address hosted this malware"). This graph structure enables threat hunters to pivot from one indicator to related ones.
- Galaxies: Predefined knowledge bases of threat actors, malware families, and attack patterns. A SOC analyst can link events to galaxy entries (e.g., "this campaign is linked to APT28/Fancy Bear") and automatically inherit associated context.
- Sharing groups: Organizations can join sharing groups with predefined rules for which attributes to share, ensuring sensitive data stays internal while threat intelligence is distributed to trusted partners.
MISP deploys on-premises, giving organizations complete control over data. Integration with endpoint, network, and SIEM tools occurs through REST APIs.
Figure 11.1 connects indicators with the context needed to assess them.
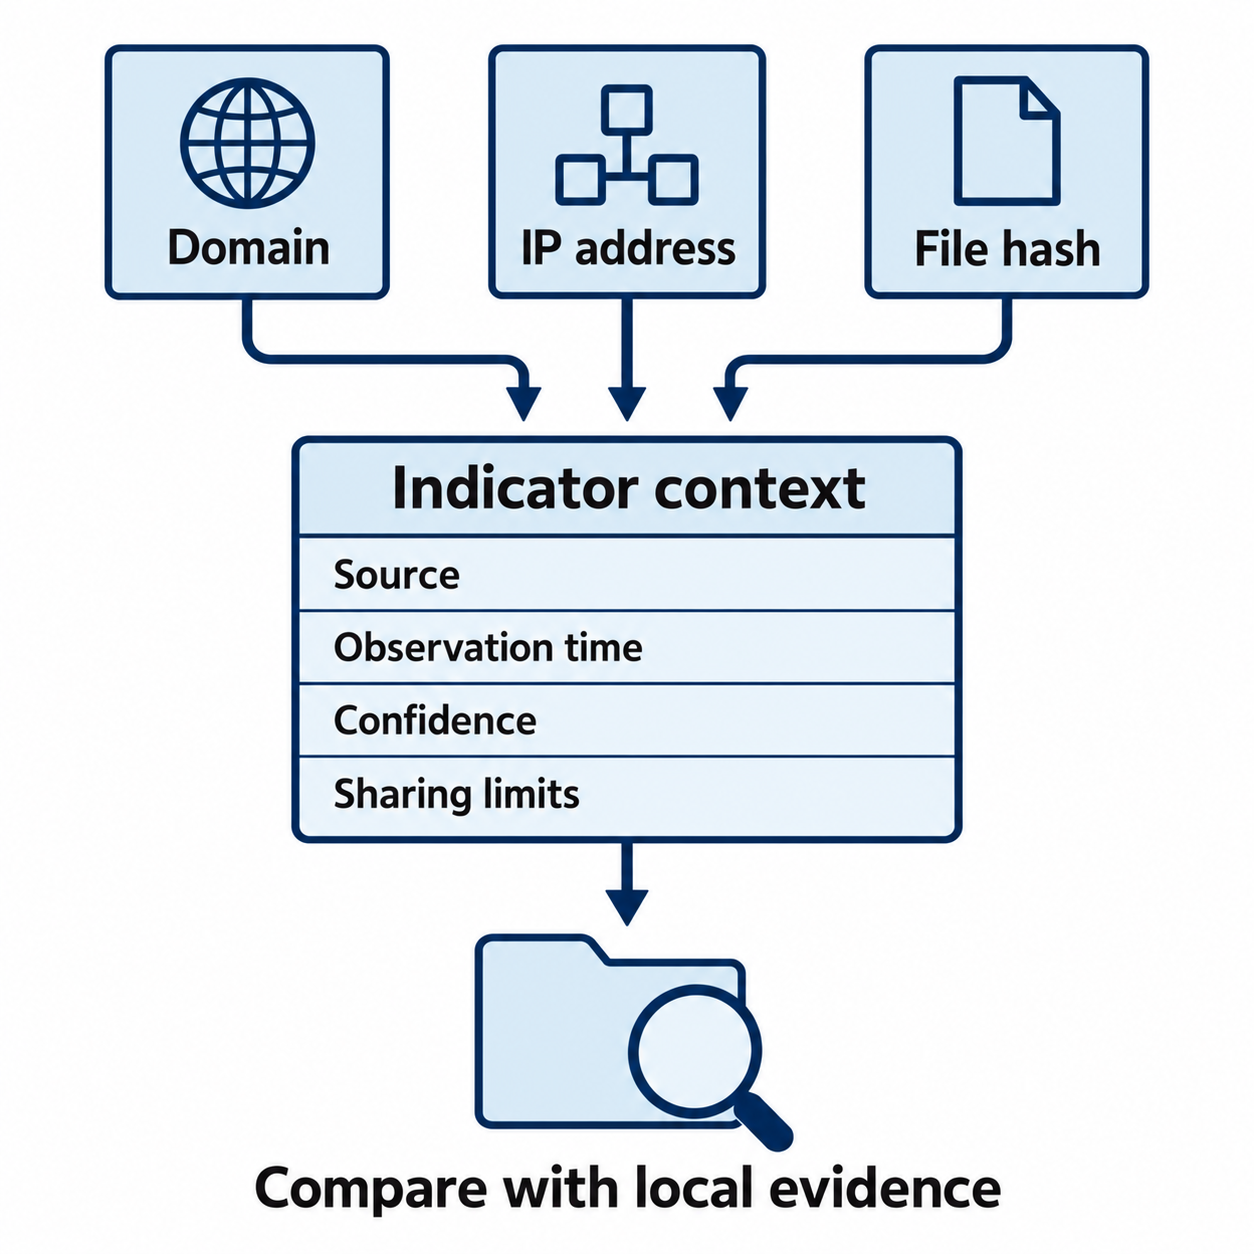
Figure 11.1: An indicator becomes useful when its source, timing, confidence, and sharing limits travel with it.
Text description for Figure 11.1
An indicator of compromise (IOC) is an observable value used to investigate possible malicious activity. Threat intelligence platforms can organize domains, addresses, hashes, and their context. Analysts assess source reliability, observation dates, confidence, and restrictions on sharing. A local match warrants investigation; it does not by itself establish that the current activity is malicious.
OpenCTI (Cyber Threat Intelligence)
OpenCTI is a modern, graph-based threat intelligence platform designed to store, correlate, and analyze complex threat relationships. Where MISP emphasizes sharing, OpenCTI emphasizes relationship mapping and visual analytics.
OpenCTI architecture:
- Knowledge graph: All entities (threat actors, malware, attack patterns, vulnerabilities, indicators) are nodes in a graph. Edges represent relationships (e.g., "threat actor X uses malware Y," "malware Y targets industry Z"). This enables analysts to answer complex queries: "What industries have been targeted by threat actors who use this malware family?"
- Connectors: Automated data importers that continuously pull indicators from external sources (MISP servers, AlienVault OTX, CISA alerts, Shodan, etc.). The knowledge graph stays synchronized with external threat intelligence in real-time.
- Data types: Campaigns, threat actors, malware families, attack patterns, tools, vulnerabilities, victim organizations, geographic locations, and indicators.
- Inferences: The system can automatically infer new relationships. If "malware X is associated with tool Y" and "tool Y is used by threat actor Z," the system infers "malware X is likely associated with threat actor Z."
OpenCTI provides a visual interface where analysts navigate the threat landscape as a network diagram, clicking nodes to explore related entities and expanding understanding of threats.
Figure 11.2 distinguishes observed connections from reported associations.
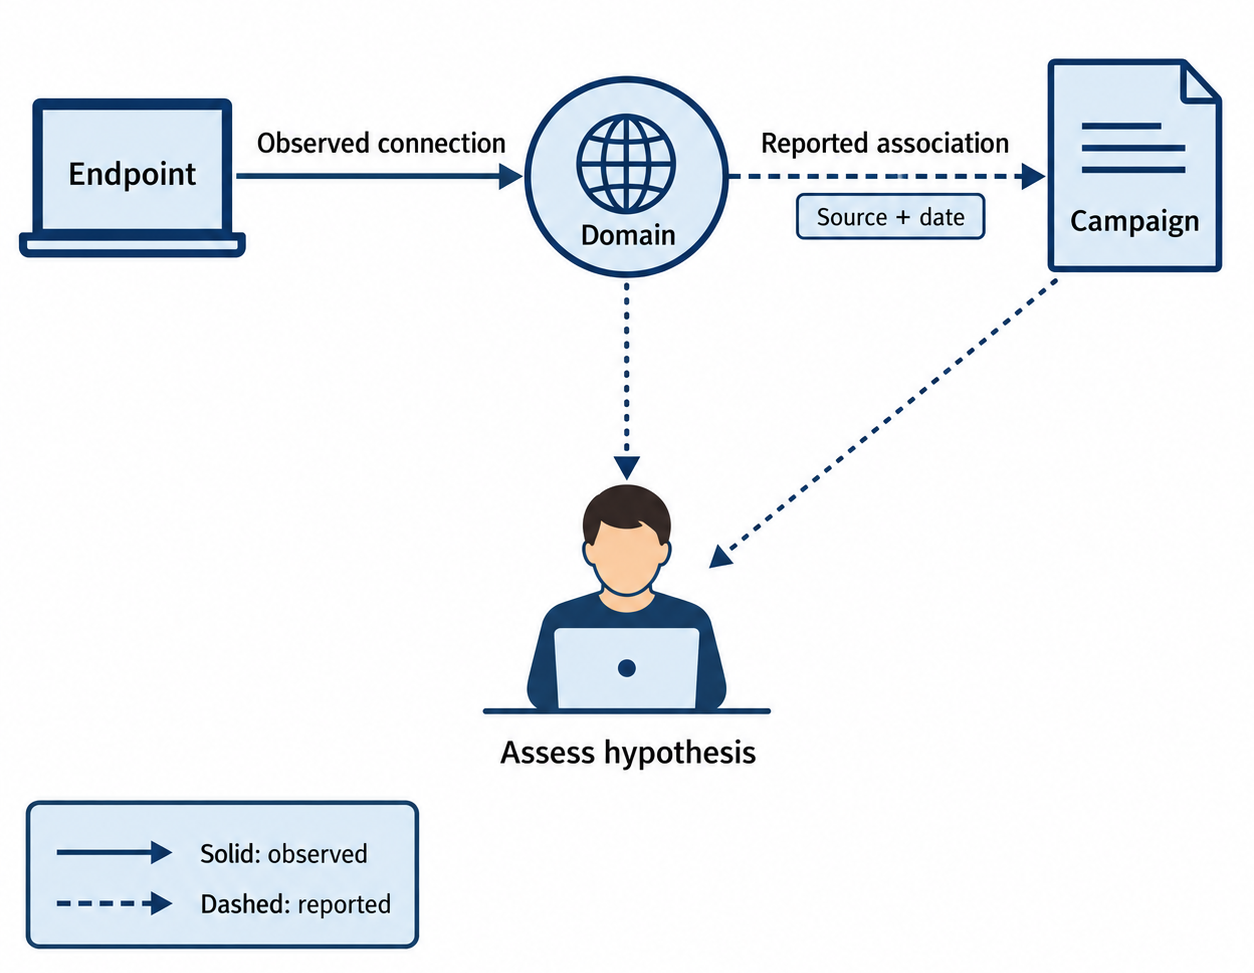
Figure 11.2: An observed connection and a reported campaign association are different kinds of evidence.
Text description for Figure 11.2
The solid edge represents a connection observed in local telemetry. The dashed edge represents an association stated by an external source. The analyst reviews that source, its date, and the relationship's confidence. A shared tool, address, or domain can appear in multiple contexts. Following graph links supports hypotheses and additional searches; it does not independently prove an actor's identity.
Putting It Together: APT28 Threat Hunting
Scenario: Your SOC team learns from a threat report that APT28 (Fancy Bear) has been conducting reconnaissance against your organization. You decide to enrich your understanding of APT28's tools, targets, and typical attack patterns.
Steps:
-
OTX: Search for "APT28" on OTX and subscribe to relevant pulses published by researchers. Collect IP addresses, domains, and file hashes associated with APT28 campaigns over the past year.
-
OpenCTI: Query the knowledge graph for "APT28" and review the relationship map. You discover that APT28 typically uses tools like Powershell Empire, reconnaissance payloads (Soupy Tangerine, Scout), and C2 frameworks. You also discover their typical targeting (government, defense, energy sectors) and geographies (Europe, Caucasus, US).
-
MISP: Check if your organization participates in a MISP sharing group for government or critical infrastructure. Research recent events tagged with APT28 and extract newly discovered IOCs.
-
Correlation: Cross-reference your network logs against the collected IOCs. Do any internal systems show connections to APT28 infrastructure? Do any internal users have opened emails from APT28-associated phishing addresses?
-
Hunting rules: Based on the tools and patterns discovered, you develop YARA rules to detect APT28 malware in file storage and tuning rules in your EDR tool to alert on process execution patterns known to APT28 (e.g., rundll32 executing specific DLLs, PowerShell invocations with encoded arguments).
11.2 Endpoint Detection and Response (EDR)
Endpoint detection and response (EDR) is security software installed on workstations, servers, and other endpoints that captures detailed telemetry: process execution, file system writes, registry modifications, network connections, and code injection attempts. Unlike traditional antivirus, which focuses on known malware signatures, EDR captures behavior to detect novel threats and provides forensic data for incident investigation.
EDR Data Collection and Analysis
Process telemetry is the most critical EDR data stream. For every process execution, EDR captures:
- Process ID and name
- Parent process (what launched this process)
- Command-line arguments
- Executable path and file hash
- User context (what user account initiated it)
- Timestamp of execution
- Child processes spawned
This is essential for detecting attacks because many exploitation techniques involve spawning unusual child processes or executing legitimate binaries from suspicious paths. A legitimate svchost.exe running from C:\Windows\System32\ is normal. The same binary running from AppData\Temp\ is a living-off-the-land (LOLBin) attack.
File operations capture when processes read, write, or delete files:
- Source process and target file path
- Type of operation (read, write, delete, rename)
- File content hash (or relevant metadata)
- Timestamp
Ransomware detection often relies on file operations: a process that suddenly writes encrypted content to thousands of files in a short time is clearly malicious. EDR tools baseline the normal rate of file writes for each user and alert when thresholds are exceeded.
Network connections logged by EDR include:
- Source and destination IP addresses
- Source and destination ports
- Protocol (TCP, UDP)
- Process initiating the connection
- Connection direction (inbound, outbound)
This is essential for detecting command-and-control (C2) communication. A process making regular connections to an external IP address on a non-standard port (e.g., port 8443 for HTTPS-like C2) is suspicious.
Registry operations (Windows) capture reads and writes to the Windows registry. Persistence mechanisms, malware configuration, and stolen credentials often reside in the registry. Monitoring for specific registry paths (HKLM\Software\Run, HKCU\Software\Microsoft\Windows\Run) enables detection of new persistence mechanisms.
Code injection detection alerts when one process attempts to inject code into another process. This is a common evasion technique: malware injects itself into a legitimate, signed binary (like explorer.exe) to hide within a trusted process.
Sysmon as an alternative without an EDR license. An organization that has not purchased an EDR product can collect much of this same telemetry with System Monitor (Sysmon), the free Microsoft Sysinternals agent covered in Chapter 2. Sysmon records process creation with command line and parent process, file creation, registry modification, network connections, and remote thread creation, and forwards them to a SIEM the same way other Windows logs are forwarded. What Sysmon does not supply is the response half of EDR. There is no console for isolating a host, terminating a process, or quarantining a file, and no vendor-maintained detection content, aside from a narrow set of file-blocking rules added in recent versions. Sysmon paired with a SIEM gives an organization the visibility to investigate an incident, while containment and eradication remain manual.
EDR Data Volume and Performance Impact
EDR tools can generate hundreds of gigabytes of telemetry per endpoint per day, particularly in high-activity environments. Organizations must balance visibility (capturing all data) against infrastructure costs (storage, indexing, retention). Most EDR tools allow tuning: focusing on high-risk processes and operations while sampling low-risk ones.
Figure 11.3 connects a process chain with its execution context.
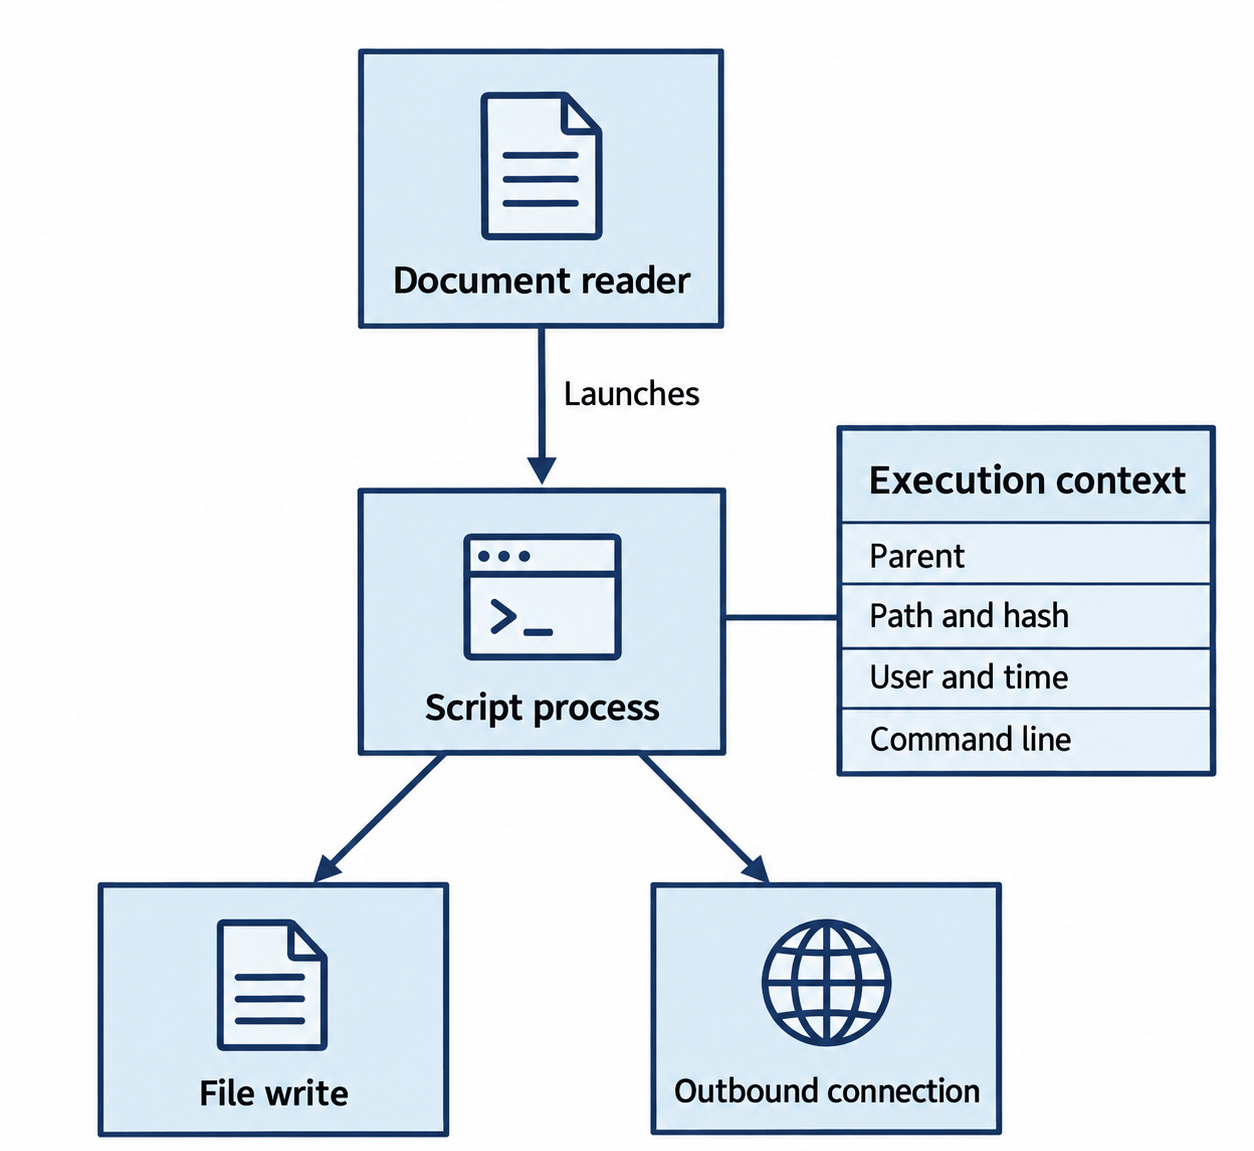
Figure 11.3: Process relationships become more informative when paired with execution context and related file or network events.
Text description for Figure 11.3
The synthetic process chain illustrates a behavior worth examining. Analysts inspect the parent process, executable path and hash, account, time, arguments, written files, and destinations. A suspicious relationship is a lead rather than proof. Telemetry coverage depends on configuration. Sysmon can supply event data for analysis, while endpoint detection and response products may add response capabilities such as isolation or process termination.
EDR Tools and Platforms
Microsoft Defender for Endpoint is integrated into Windows 10/11 and provides EDR functionality at scale across enterprise environments. It integrates with Windows Event Logs and Azure AD, providing rich context for analysis. Strengths include deep OS integration and cloud-based threat intelligence. Limitations include Windows-only coverage.
CrowdStrike Falcon is a leading cloud-native EDR platform. Falcon deploys as a lightweight agent and connects to CrowdStrike's cloud backend for processing and storage. Strengths include fast deployment, strong threat intelligence integration, and cross-platform support (Windows, macOS, Linux). Cost is significant but justified by comprehensive protection.
SentinelOne is an autonomous EDR platform emphasizing behavioral analysis and automated response. SentinelOne uses machine learning to detect anomalous process execution and file operations. Strengths include local processing (reducing cloud dependency) and strong auto-remediation capabilities.
Elastic EDR is open-source, self-hosted EDR built on the Elastic Stack. Strength is cost and flexibility; limitations include requiring operational overhead to manage.
EDR Alert Triage
When an EDR alert fires, the analyst follows a triage process:
-
Alert validation: Is this a true positive or false positive? Check process name, path, parent process, and command-line arguments against baselines and threat intelligence.
-
Scope assessment: Is this a single isolated process or part of a larger pattern? Query EDR for related processes on the same endpoint or across the network.
-
Threat intelligence: Cross-reference file hashes, IP addresses, and domain names against threat intelligence platforms.
-
Forensic preservation: If the alert appears to be true positive, preserve endpoint state: memory dump, file system snapshot, registry export, running process list, open network connections.
-
Escalation decision: Escalate to incident response team for investigation or close as false positive with documentation.
Figure 11.4 follows an alert through evidence gathering and a documented decision.
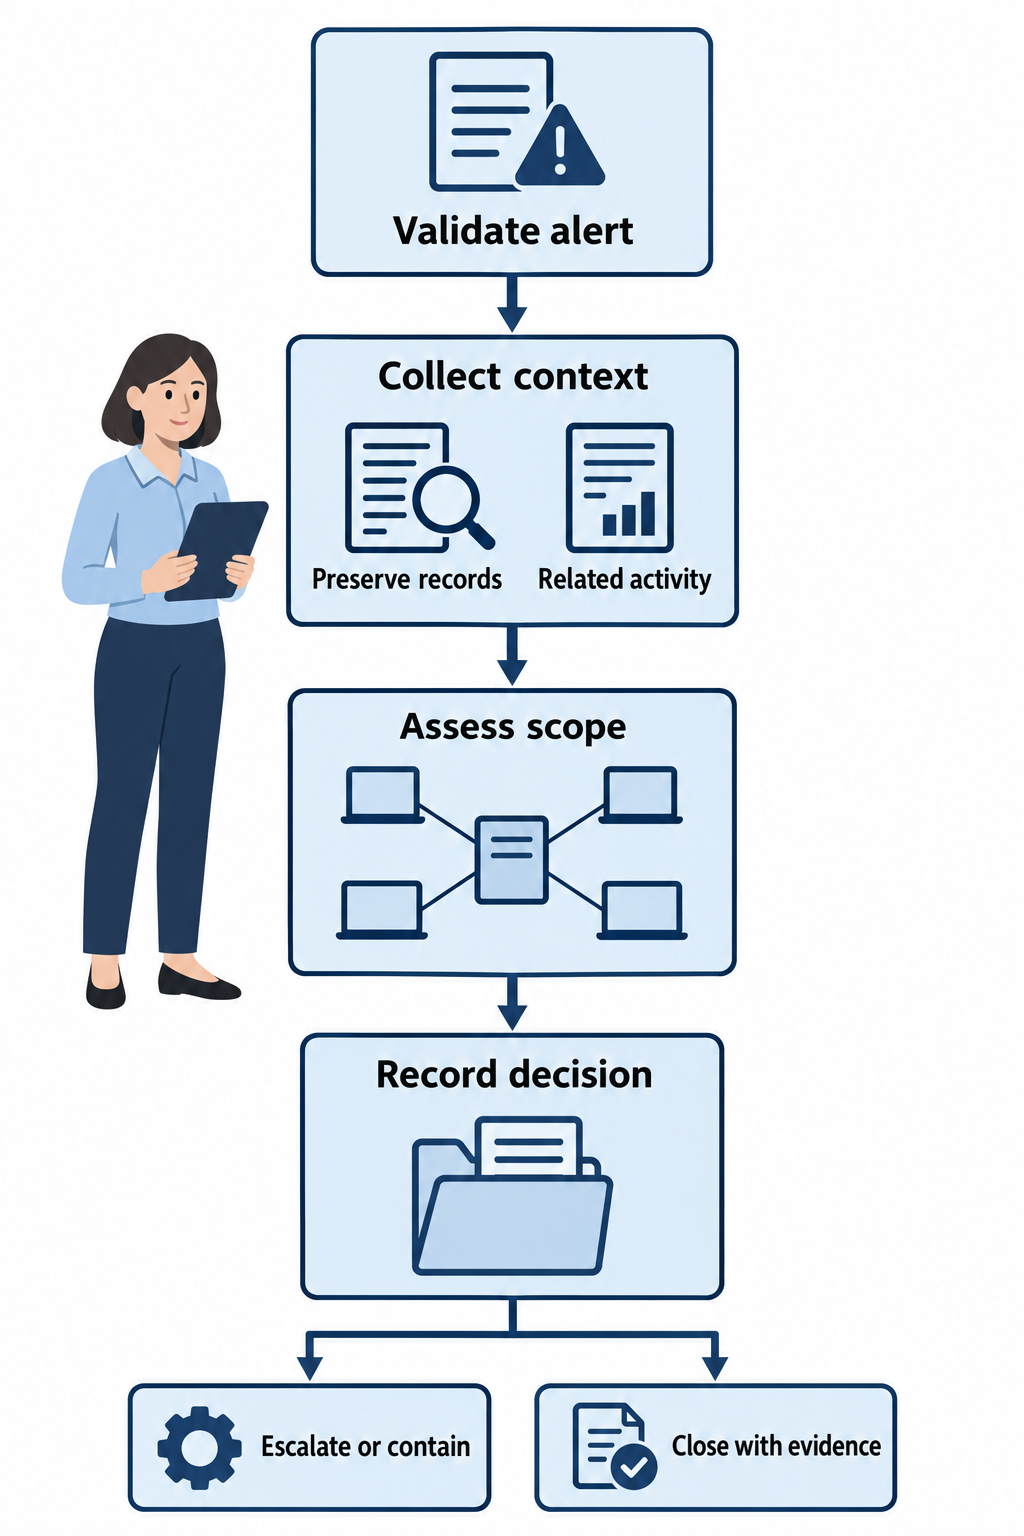
Figure 11.4: Triage combines alert validation, supporting evidence, scope assessment, and a documented disposition.
Text description for Figure 11.4
An analyst checks what triggered the alert and preserves relevant records. They compare related endpoint, account, network, and application activity to assess scope and urgency. A high-risk situation can require containment under the response plan before the full investigation is complete. Record the evidence, actions, unresolved questions, and reason for escalation or closure.
11.3 File Analysis Tools and Sandboxing
When an EDR tool detects a suspicious file or an email gateway blocks a malicious attachment, the next step is deep file analysis: determining what the file does, whether it is malware, what family it belongs to, and what indicators can be extracted for hunting and blocking.
VirusTotal
VirusTotal is a free, cloud-based file analysis service where analysts can upload files to be scanned by 70+ antivirus engines, behavioral analysis systems, and other security tools simultaneously. It is available for free with registration.
VirusTotal analysis includes:
- Antivirus detection: Results from 70+ antivirus engines. If 30 engines detect the file as malware, it is almost certainly malicious. If only 1-2 detect it, it may be a false positive or a novel variant.
- File properties: File name, size, type (PE executable, DLL, script, etc.), and compile timestamp.
- Hash information: MD5, SHA1, SHA256, SSDEEP (fuzzy hash). The analyst can search for files similar to the submitted file, finding related malware variants.
- Behavioral analysis: Sandbox reports showing what the file does when executed (processes created, files written, registry modified, network connections).
- Threat intelligence: Which threat actors or malware campaigns are associated with the file hash.
- Community scores: Votes from the VirusTotal community on whether the file is malware, legitimately used by attackers (e.g., legitimate software exploited), or benign.
VirusTotal Data Privacy
VirusTotal is a public service. Files uploaded to VirusTotal are scanned and stored in VirusTotal's database, potentially made available to researchers and competitors. Do not upload sensitive source code, customer data, or proprietary information to VirusTotal. For sensitive files, use private sandboxes like Joe Sandbox or Cuckoo.
Figure 11.5 compares static and dynamic file analysis.
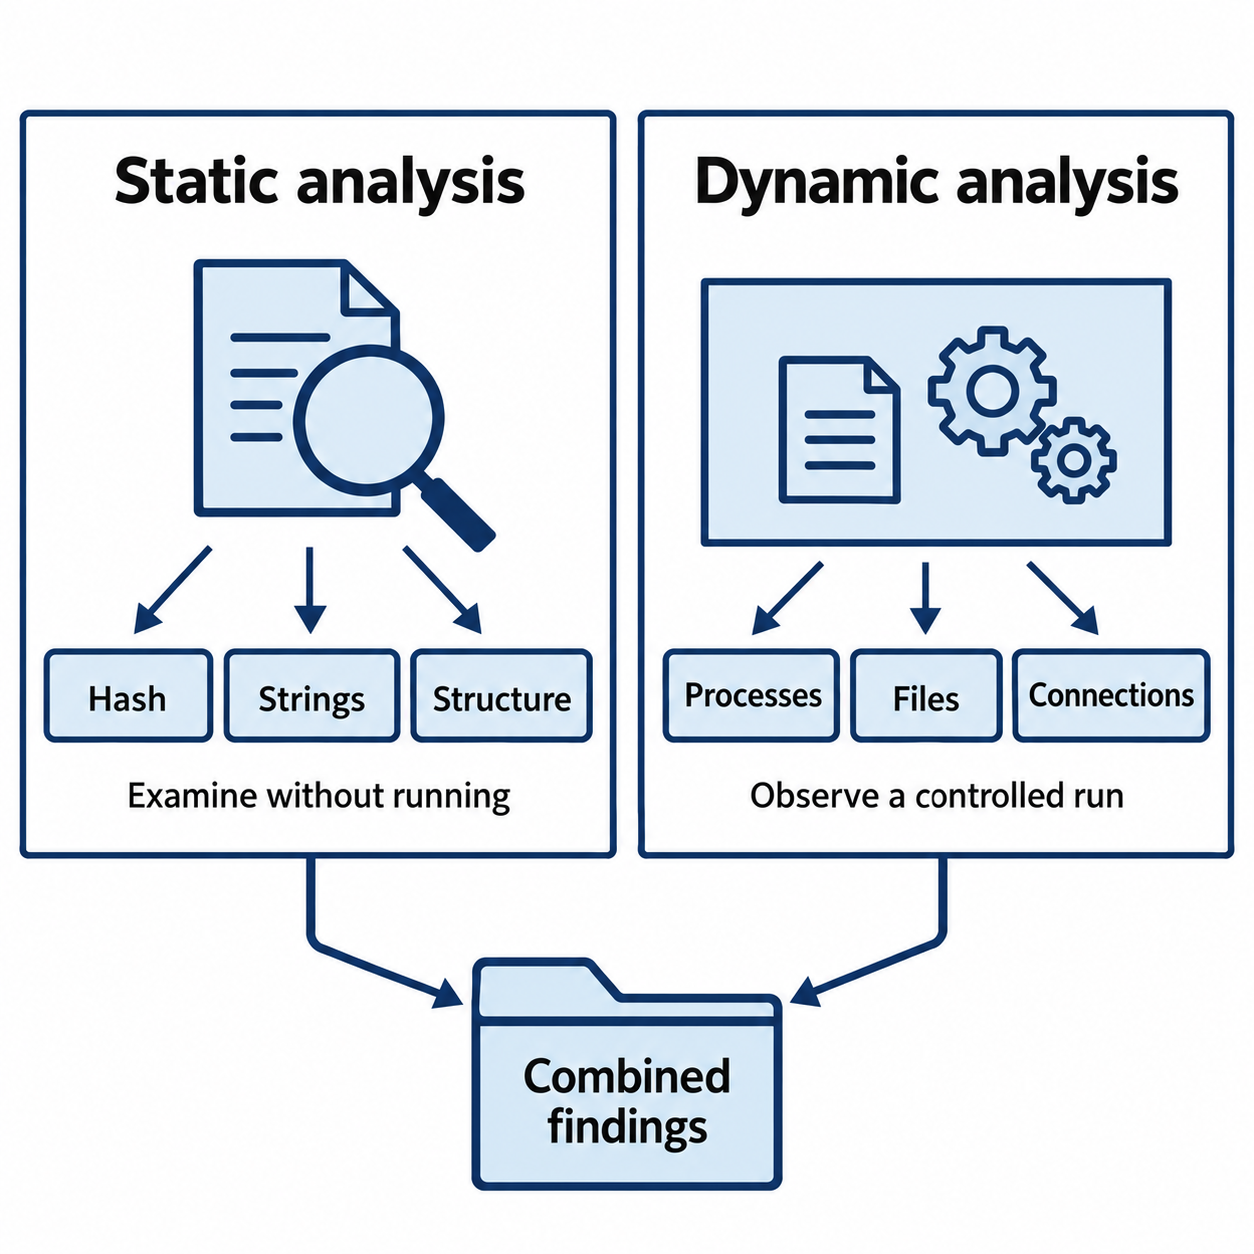
Figure 11.5: Static analysis examines a file's contents; dynamic analysis observes behavior in a controlled environment.
Text description for Figure 11.5
Static analysis inspects file data without deliberately executing the sample. Dynamic analysis runs it in a controlled environment and records observed behavior. Both have limits: packed or encrypted content can conceal strings, and environmental conditions can prevent behavior from appearing during a run. Use approved tools and handling procedures, and combine findings with the investigation's context.
YARA Rules
YARA is a pattern-matching engine for identifying malware. A YARA rule is a set of conditions that describe characteristics of a specific malware family. Rules can match on file signatures (byte patterns), strings, or metadata. When executed against a file or file system, YARA identifies matches.
YARA rule structure:
rule Emotet_Variant_001 {
    meta:
        author = "SOC Team"
        date = "2024-01-15"
        malware_family = "Emotet"
    strings:
        $string1 = "CreateProcessA" nocase
        $string2 = "InternetOpenUrlA"
        $hex1 = { 55 8B EC 83 EC 20 }
    condition:
        all of them
}
The rule searches for specific strings and byte sequences. If a file contains all of them, the rule matches. YARA rules are used to:
- Scan file systems: Organizations run YARA against all stored files to identify known malware variants.
- Hunt for malware: When a new malware family is discovered, researchers publish YARA rules that hunters can apply to their networks.
- Classify malware: When an incident response team discovers a new file, YARA rules help determine if it belongs to a known family.
YARA rules are published by security vendors, open-source projects like YARA-Rules, and threat intelligence platforms like Alien Vault OTX.
Figure 11.6 shows how a YARA condition produces a match.
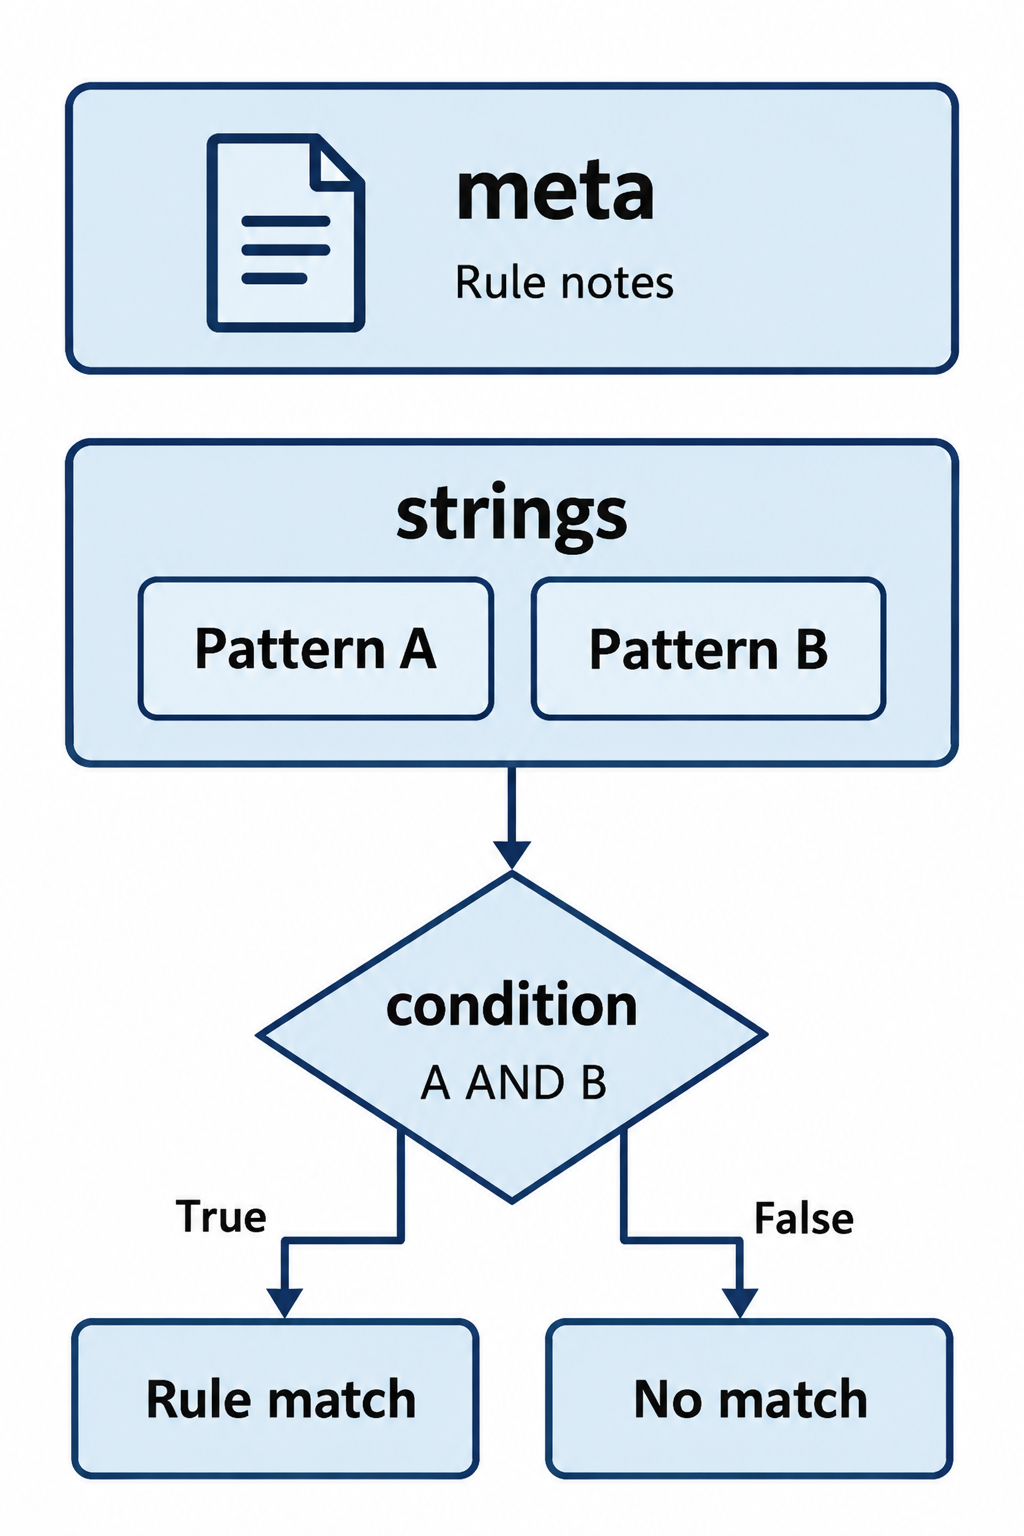
Figure 11.6: A YARA rule's condition determines the match. Its metadata documents the rule.
Text description for Figure 11.6
In this illustrative YARA rule, both Pattern A and Pattern B must be present for the condition to be true. Real rules can also use sizes, offsets, modules, and other supported expressions. The meta section stores descriptive information about the rule and does not supply matching criteria to the condition. A match indicates that the tested criteria were met, which still requires interpretation.
Strings Analysis
The strings utility is a command-line tool that extracts human-readable text from binary files. Attackers often embed configuration, C2 addresses, and other metadata as plaintext strings within malware executables.
Example:
$ strings suspicious_binary.exe | grep -i "c2\|command\|http"
http://malicious.com:8080/api
POST /cmd HTTP/1.1
User-Agent: Mozilla/5.0
Strings analysis is fast and requires no execution, making it safe. However, it only reveals strings explicitly embedded in the binary. Sophisticated malware encrypts configuration and rebuilds strings at runtime, hiding them from static strings analysis.
Sandboxing: Joe Sandbox and Cuckoo
A sandbox is an isolated execution environment where malware can be safely executed and its behavior monitored. Sandboxes capture:
- Process execution and inter-process communication
- System calls and API invocations
- File system modifications
- Registry modifications
- Network connections and DNS queries
Joe Sandbox is a commercial sandbox with proprietary analysis engines. Features include:
- Multiple analysis profiles (Windows XP through Windows 11, different software stacks)
- Kernel-level monitoring with low evasion bypass
- Analysis report with behavior chains, network traffic, dropped files
- API integration for automation
Cuckoo Sandbox is an open-source sandbox that analysts deploy on-premises. Cuckoo is less polished than Joe Sandbox but offers cost savings and complete control over analysis environment.
Figure 11.7 shows the boundary around controlled sample execution.
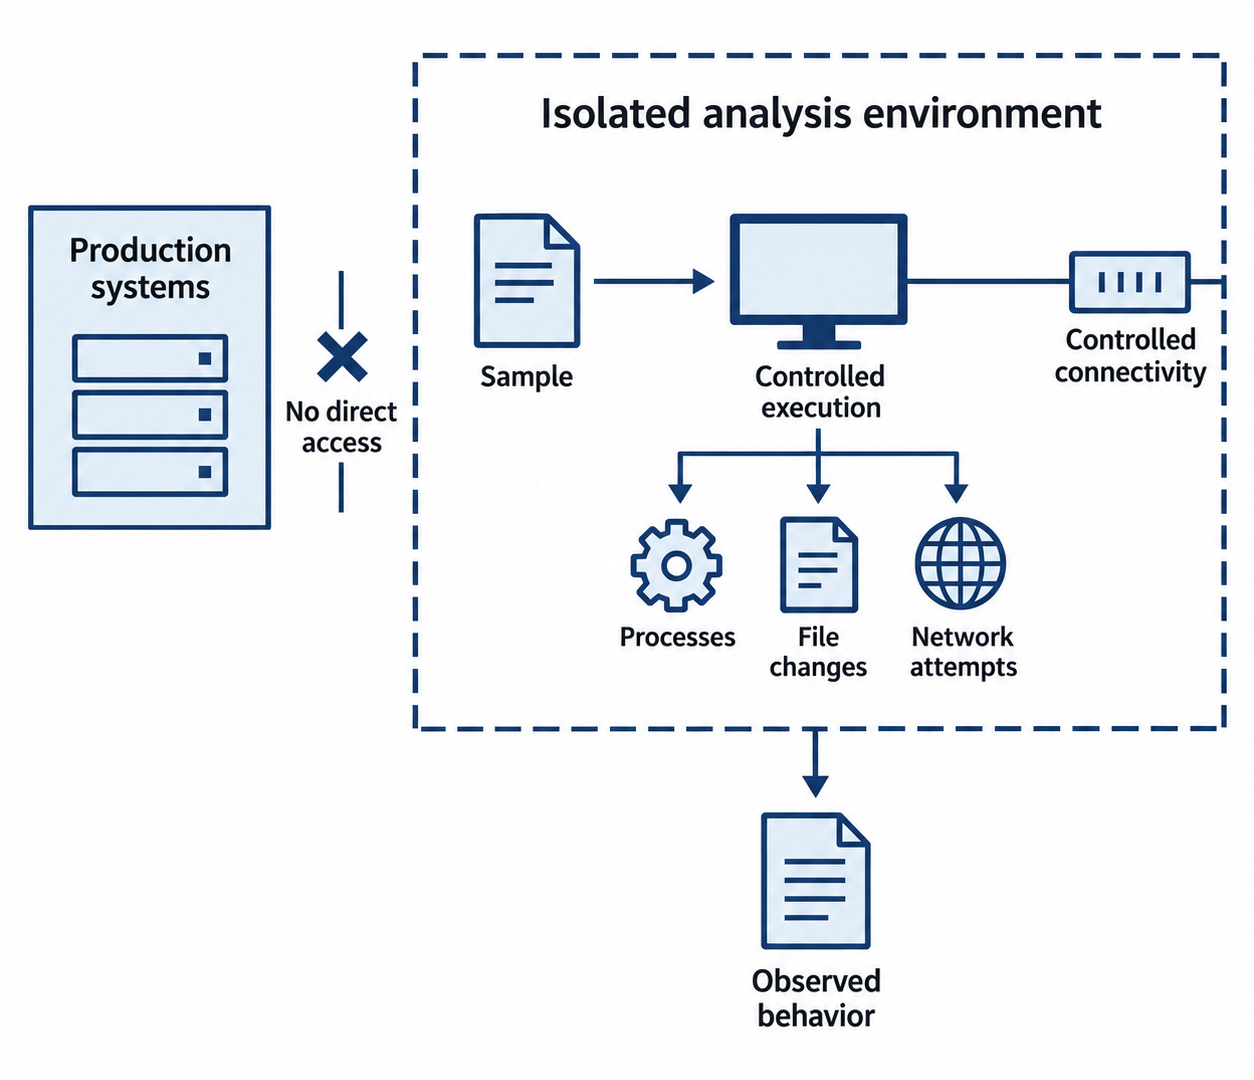
Figure 11.7: A sandbox constrains execution and records behavior under the conditions tested.
Text description for Figure 11.7
Dynamic analysis runs a sample in an environment designed to limit access to production resources and control network activity. Monitoring produces a report of behavior observed during that run. The report is not a complete statement of everything the sample can do: timing, missing dependencies, and evasion can affect results. Verify the deployment's containment and data-sharing settings before submitting sensitive material.
Putting It Together: Analyzing a Trojan Attachment
Scenario: An employee receives an email with a suspicious PDF attachment. The email appears to come from a trusted vendor but has unusual formatting. Your email gateway does not block it, and the employee is cautious but uncertain. The attachment is quarantined and submitted to you for analysis.
Steps:
-
Initial reconnaissance: Note the filename, sender address, subject line, and email timestamps. Check email headers for SPF/DKIM/DMARC failures.
-
VirusTotal: Upload the PDF to VirusTotal. Result: 5 antivirus engines detect it as a Trojan. The file hash matches a known malware campaign from 2 weeks ago.
-
Strings analysis: Extract strings from the PDF using the
stringscommand. Discover embedded JavaScript code that references suspicious URLs. -
Joe Sandbox: Execute the file in Joe Sandbox's Windows environment. Behavior report shows:
- PDF reader (Adobe Reader) launches
- JavaScript executes and downloads a secondary payload from a suspicious domain
- Payload creates a scheduled task for persistence
-
Payload makes HTTP requests to a C2 server
-
Threat intelligence: Cross-reference the C2 domain against threat intelligence. It is associated with the Dridex banking trojan. Behavioral indicators (scheduled task creation, specific registry modifications) match published indicators for Dridex.
-
Hunting: You develop YARA rules for the dropper (the PDF) and the payload. You search your network for similar files, finding 3 additional machines with the same file hash, indicating a broader compromise.
-
Response: Affected endpoints are isolated. Incident response team investigates the scope of lateral movement.
11.4 Domain and IP Reputation Services
Threat intelligence extends beyond files to infrastructure: IP addresses, domain names, and email addresses. Reputation services aggregate abuse reports, connect infrastructure to threat actors, and provide geolocation data.
WHOIS and Reverse DNS
WHOIS queries return domain registration and IP address ownership information. Public WHOIS databases allow anyone to query:
- Domain registrant name and contact information
- Domain registrar and registration date
- Nameservers
- IP address owner and network operator
Example WHOIS query:
$ whois malicious-domain.com
Domain Name: MALICIOUS-DOMAIN.COM
Registrar: NameCheap, Inc.
Registrant Name: Privacy Protected
Creation Date: 2024-01-10
Expiration Date: 2025-01-10
Name Server: ns1.bulletproof-hosting.net
Name Server: ns2.bulletproof-hosting.net
The registrant name is privacy-protected (the registrar hides the true identity), but the nameservers are suspicious. A search on the nameserver IP reveals it is hosted on bulletproof hosting, a known provider of malicious infrastructure.
Reverse DNS translates an IP address back to its hostname. A PTR record provides this mapping. Legitimate businesses assign hostnames like "mail.company.com" to their mail servers. Bulletproof hosting providers often do not configure PTR records, leaving reverse DNS unresolved. Lack of reverse DNS is a risk factor, though not definitive proof of malice.
AbuseIPDB
AbuseIPDB is a community-driven database of IP addresses reported for malicious activity: brute force attacks, DDoS, phishing, hosting malware. Analysts can:
- Search an IP address to see how many reports it has received
- View report summaries and classifications
- Query an IP's historical abuse score
- Report an IP for abuse
AbuseIPDB reports are user-submitted, so quality varies. An IP with 200+ reports from diverse sources is almost certainly malicious. An IP with 1-2 reports may be a false positive or a legitimate service attacked by an adversary.
GeoIP Databases
GeoIP services map IP addresses to geographic locations: country, city, ASN (autonomous system number), ISP, and other metadata. Free GeoIP databases like MaxMind GeoLite2 are available for commercial and research use.
GeoIP helps analysts assess risk:
- Is an internal user connecting from an impossible geography (user in New York at 2:00 AM, then London at 3:30 AM)?
- Is a server communicating with an IP in a country where the organization does not do business?
- Is beaconing to a residential IP range in a sanctioned country?
Figure 11.8 combines reputation context with local evidence.
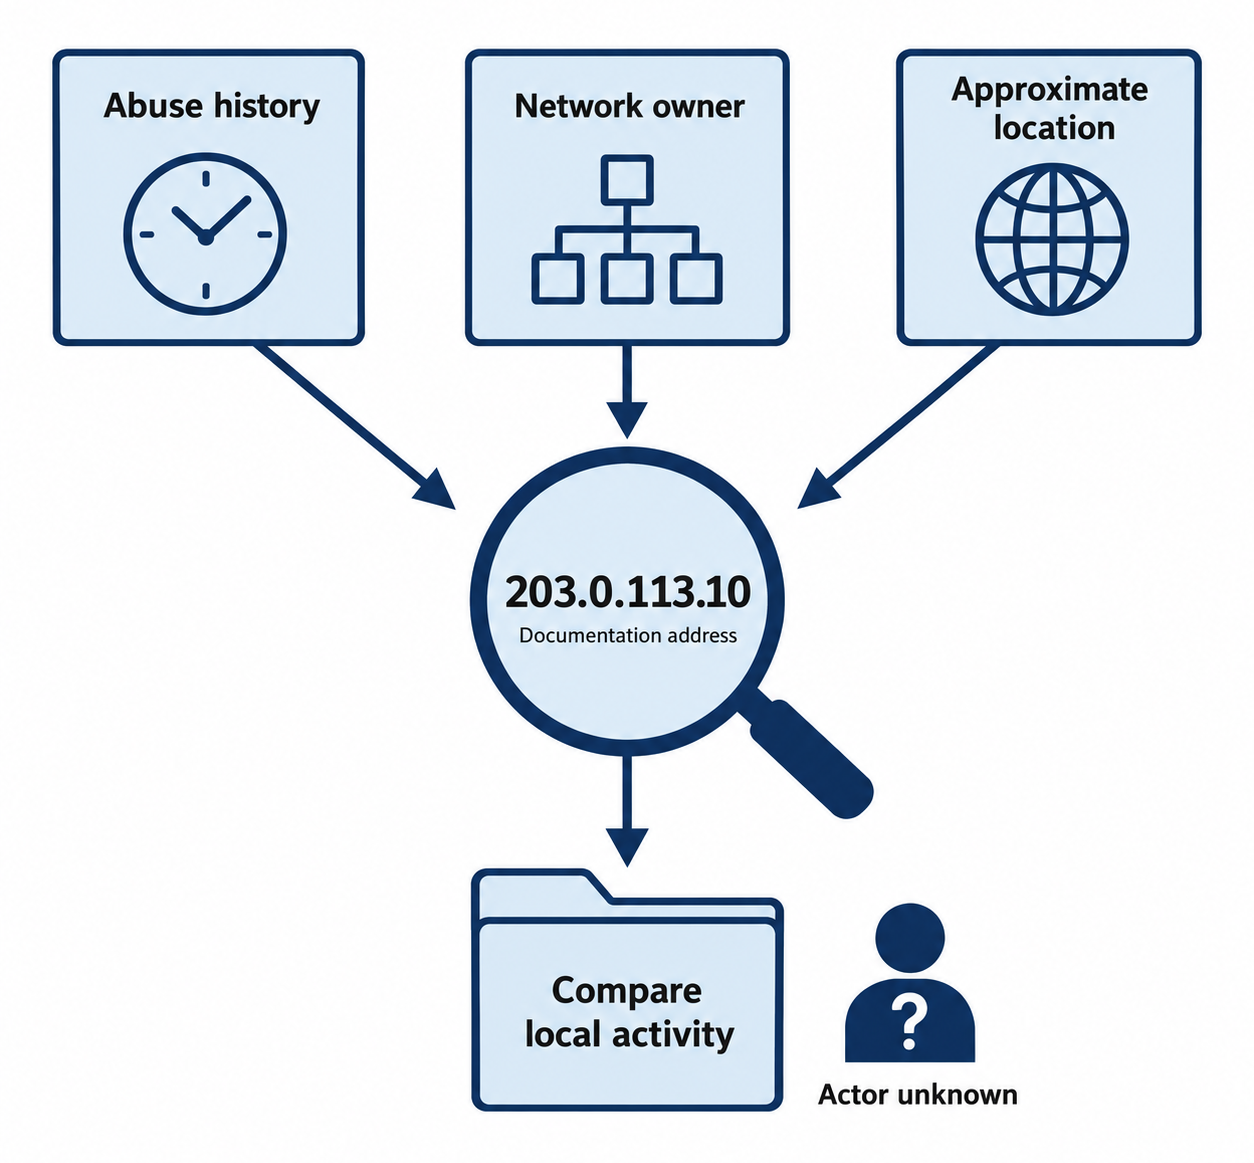
Figure 11.8: Reputation and location data provide context for an address; local activity and corroboration determine the assessment.
Text description for Figure 11.8
The documentation address 203.0.113.10 has no asserted real-world reputation in this illustration. An investigation would examine report dates, sources, ownership, shared infrastructure, and locally observed behavior. Geolocation estimates where network infrastructure may be located; a proxy, VPN, cloud host, or reassigned address can complicate interpretation. These sources do not independently identify a person or prove current malicious use.
11.5 UEBA: User and Entity Behavior Analytics
User and Entity Behavior Analytics (UEBA) applies machine learning to detect when users or systems deviate from normal behavior. Unlike rule-based detection (which triggers on specific known patterns), UEBA learns what normal looks like and alerts on anomalies.
UEBA Data Sources
UEBA ingests data from:
- Authentication logs: Login times, locations, IP addresses, success/failure.
- Network logs: Outbound connections, data transfers, protocol usage.
- Endpoint logs: Process execution, file access, resource usage.
- Application logs: Database queries, file access, privilege changes.
- Email logs: Sender, recipient, message size, attachments, external recipients.
UEBA Detections
Typical UEBA detections include:
- Impossible travel: User logs in from New York, then 30 minutes later from London (geographically impossible).
- Access from new location: User logs in from a country they have never logged in from before.
- Off-hours access: User logs in at 3:00 AM, outside their normal work hours.
- Privilege escalation: User who normally has standard permissions suddenly acquires admin privileges.
- Data exfiltration: User suddenly transfers gigabytes of data to external email or cloud storage.
- Lateral movement: User accessing resources on systems they have never accessed before.
Challenges with UEBA
UEBA is powerful but has limitations:
- False positives: Employees travel, work odd hours, and change roles. Distinguishing legitimate behavior change from compromise requires tuning.
- Baseline requirements: UEBA requires weeks of data collection to establish baselines. New users and systems trigger high false positive rates initially.
- Insider threats: UEBA is excellent for detecting compromised accounts but less effective for detecting malicious insiders (employees intentionally stealing data) because their behavior may be legitimate.
Open-source UEBA tools like OpenUBA exist, but commercial UEBA (Exabeam, Rapid7 InsightIDR) are more mature.
Figure 11.9 shows how a behavioral deviation leads to contextual review.
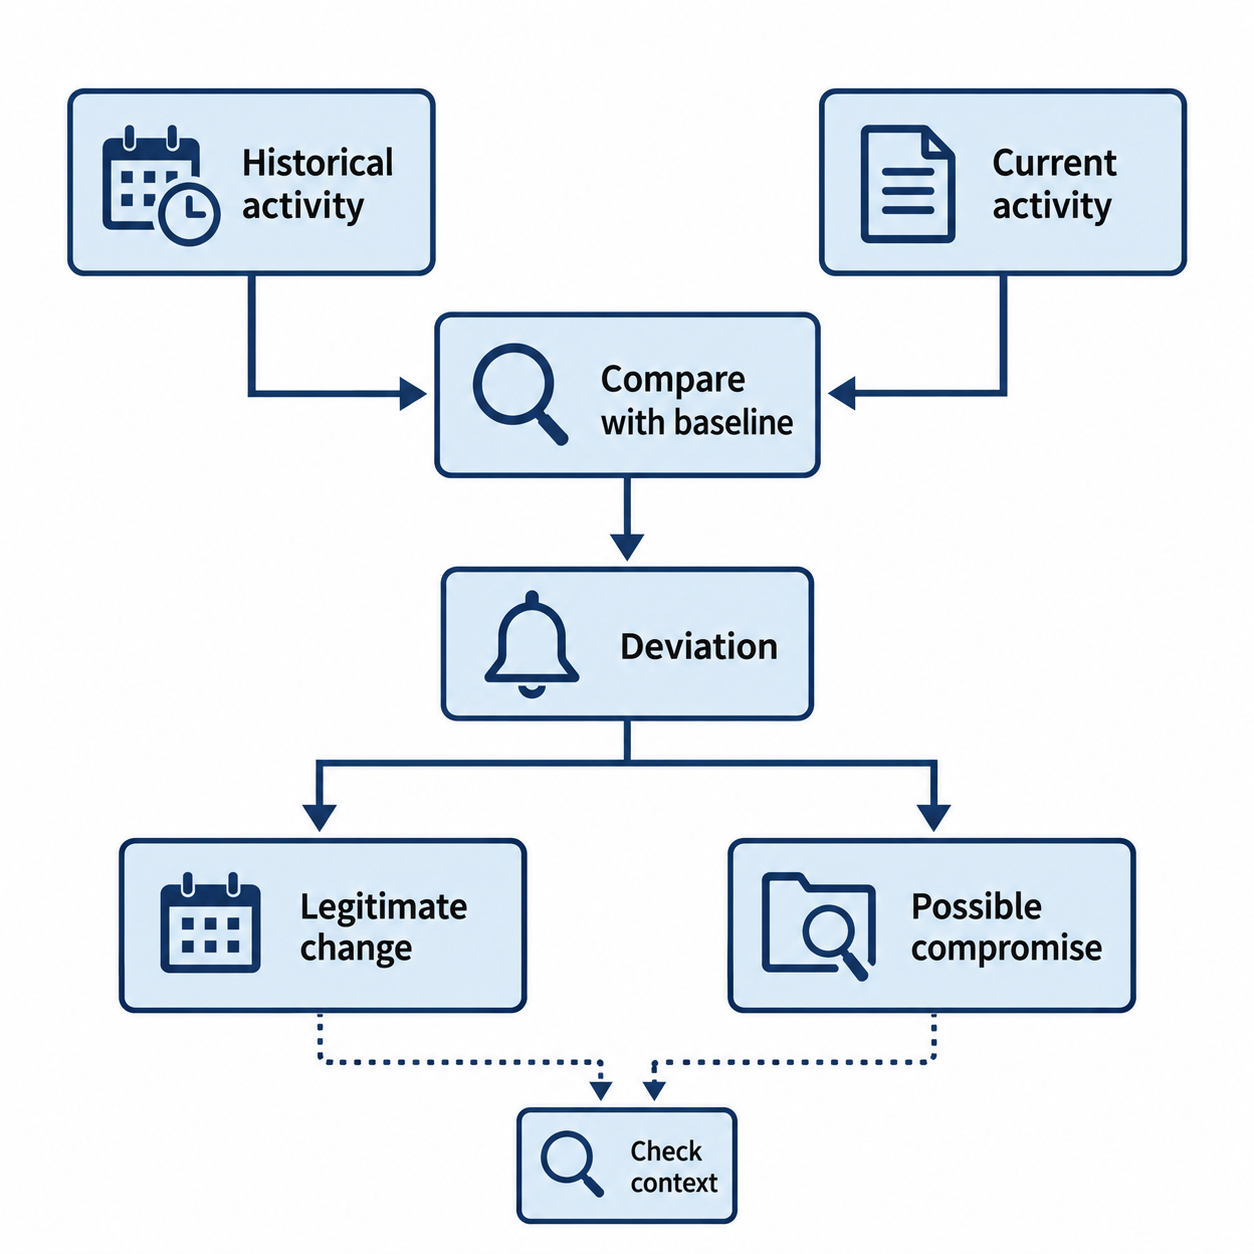
Figure 11.9: A deviation from a behavioral baseline prompts an assessment of both legitimate change and possible compromise.
Text description for Figure 11.9
User and entity behavior analytics (UEBA) compares observed activity with learned or configured expectations. An unusual login time, destination, or data transfer can prompt investigation. Role changes, travel, maintenance, and special projects can also explain deviations. Analysts use account, device, session, and business context to decide what the signal means and adjust baselines when appropriate.
11.6 Scripting and Automation
Many SOC tasks are repetitive and suitable for automation: querying threat intelligence platforms for thousands of IOCs, extracting indicators from logs, initiating containment procedures, or updating firewall rules. Scripting enables analysts to scale their work.
Python for Threat Intelligence Integration
Python is the standard language for security automation. The Requests library enables HTTP queries:
import requests

def check_virustotal(file_hash):
    api_key = "YOUR_VT_API_KEY"
    url = f"https://www.virustotal.com/api/v3/files/{file_hash}"
    headers = {"x-apikey": api_key}
    response = requests.get(url, headers=headers)
    result = response.json()
    return result["data"]["attributes"]["last_analysis_stats"]

# Check a file
stats = check_virustotal("d41d8cd98f00b204e9800998ecf8427e")
print(f"Malicious: {stats['malicious']}, Undetected: {stats['undetected']}")
This script queries VirusTotal's API for a single file hash. Extended, it could process thousands of hashes from a list, enriching them with threat intelligence before alerting.
Figure 11.10 shows a hash-query workflow with explicit response handling.
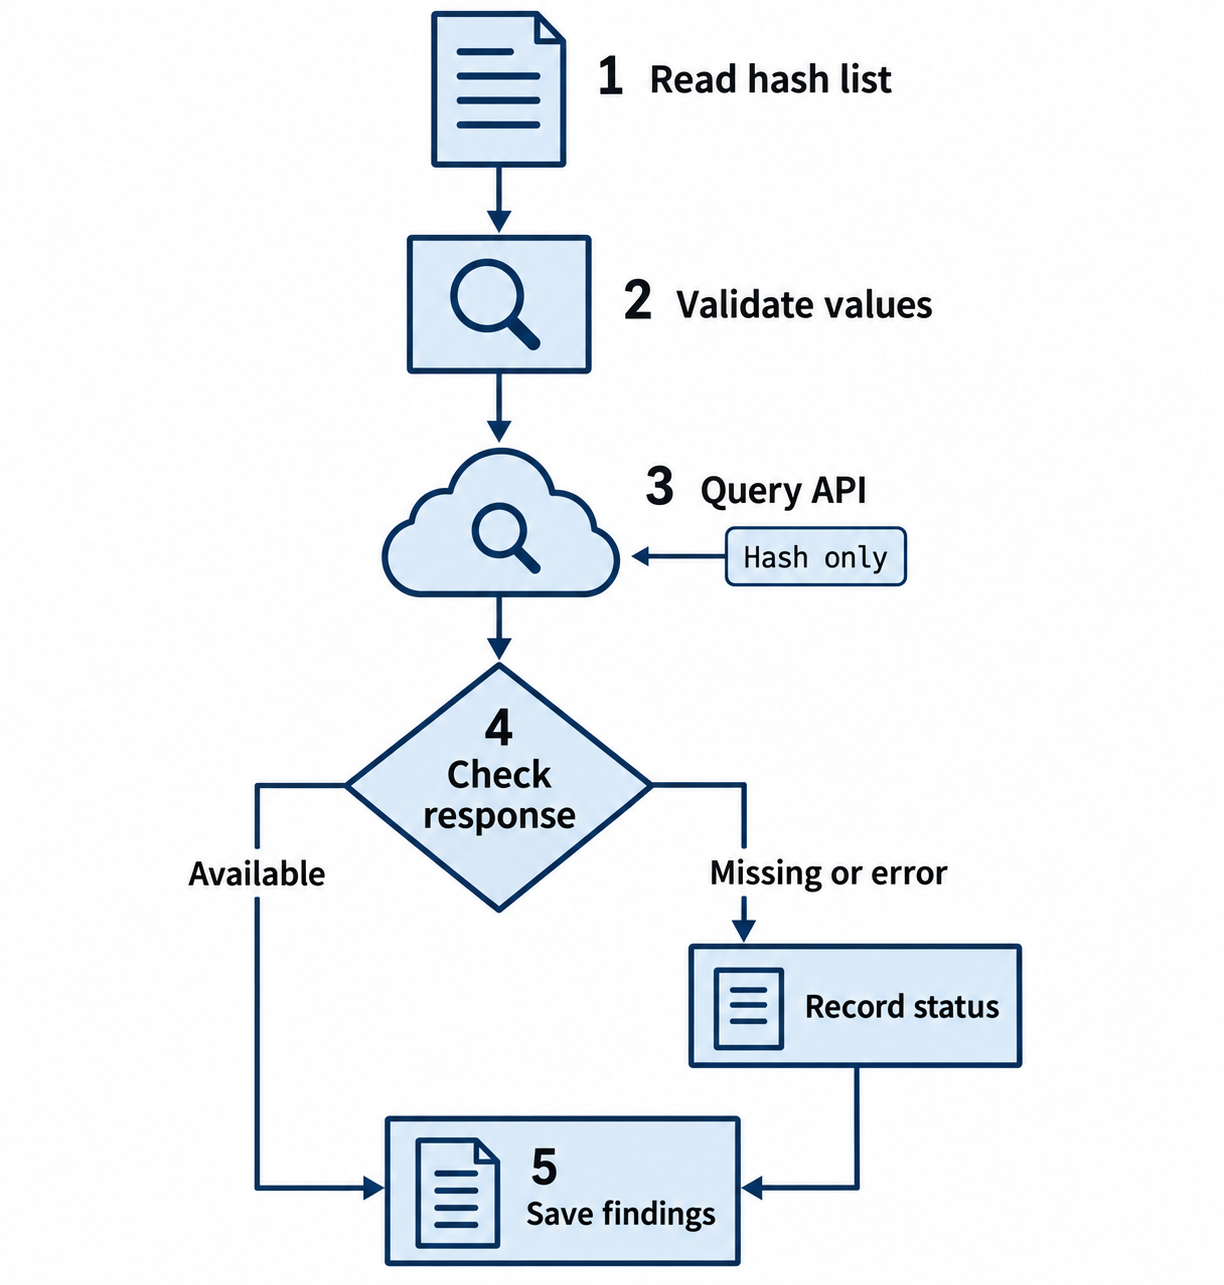
Figure 11.10: A hash-lookup workflow records both available findings and missing or failed responses.
Open Figure 11.10 at full size
Text description for Figure 11.10
A file-hash lookup asks a service for an existing report about a digest. It does not upload the file itself. An automation workflow validates input, uses an authorized API credential, handles timeouts, authentication failures, rate limits, and missing reports, and records the result with source and time. A filename field is not a malware-family classification. Review output before using it to drive response actions.
PowerShell for Windows Automation
PowerShell is native to Windows and provides access to Windows APIs, event logs, and Active Directory. A PowerShell script can query the Windows Event Log for suspicious logons:
$EventFilter = @{
    LogName = 'Security'
    ID = 4625  # Failed logon
    StartTime = (Get-Date).AddHours(-1)
}
Get-WinEvent -FilterHashtable $EventFilter | Where-Object {
    $_.Properties[8].Value -gt 10  # Failed attempts > 10
} | Select-Object TimeCreated, Properties[0].Value
This retrieves failed logon events from the past hour and filters for accounts with more than 10 failures, indicating a possible brute force attack.
Figure 11.11 shows how failed-logon counts are calculated from records.
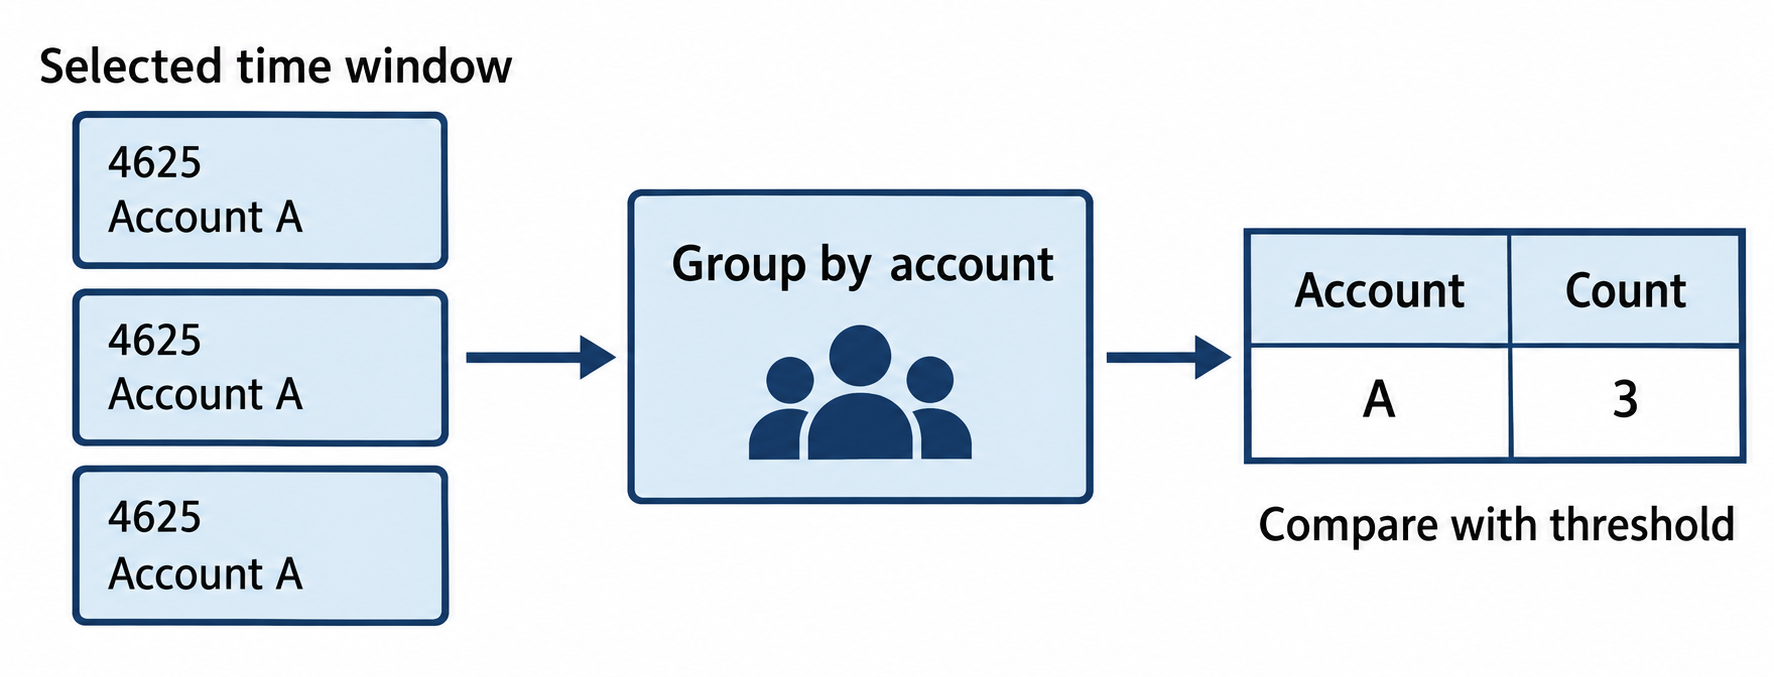
Figure 11.11: Count selected failed-logon records by account before applying an investigation threshold.
Open Figure 11.11 at full size
Text description for Figure 11.11
Select failed-logon events in an explicit time window, parse the intended account field, group records by that field, and count each group. The illustrative result is three failures for Account A. Event properties describe a single event; a property value is not an accumulated failure count. Investigators also consider source, host, logon type, status, and legitimate causes before interpreting a threshold crossing.
Shell Script for Log Analysis
Bash and other shell languages are efficient for text processing:
#!/bin/bash
# Extract successful SSH logins in the past hour from auth.log
grep "Accepted" /var/log/auth.log | \
    awk '{print $1, $2, $3, $9, $11}' | \
    tail -n 100 | \
    sort -u

# Count failed SSH attempts by source IP
grep "Failed password" /var/log/auth.log | \
    grep "$(date +%b\ %d)" | \
    awk '{print $11}' | \
    sort | uniq -c | sort -rn | head -20
This script extracts recent successful logins and identifies the top sources of failed login attempts.
Putting It Together: Automating Incident Response
Scenario: Your organization has been targeted by a ransomware campaign. You have 50 suspicious files that need to be analyzed. Rather than uploading each to VirusTotal manually, you write a Python script that:
- Reads a CSV list of file hashes
- Queries VirusTotal for each hash
- Extracts malware family, detections, and C2 domains
- Writes a report CSV
- Alerts your SIEM of detected domains to search your logs for outbound connections
import requests
import csv

api_key = "YOUR_VT_API_KEY"
hashes_file = "suspicious_hashes.csv"
output_file = "vt_analysis.csv"

results = []
with open(hashes_file) as f:
    for hash_value in f:
        hash_value = hash_value.strip()
        response = requests.get(
            f"https://www.virustotal.com/api/v3/files/{hash_value}",
            headers={"x-apikey": api_key}
        )
        data = response.json()["data"]["attributes"]
        results.append({
            "hash": hash_value,
            "detections": data["last_analysis_stats"]["malicious"],
            "family": data.get("meaningful_name", "Unknown"),
        })

with open(output_file, 'w', newline='') as out:
    writer = csv.DictWriter(out, fieldnames=["hash", "detections", "family"])
    writer.writeheader()
    writer.writerows(results)

print(f"Analysis complete. Results in {output_file}")
This reduces 50 manual uploads to a single command: python analyze_hashes.py
Chapter Summary
-
Threat intelligence platforms (OTX, MISP, OpenCTI) centralize IOC research and allow analysts to pivot from one indicator to related entities. Integration with detection systems enables real-time enrichment of alerts.
-
Endpoint Detection and Response (EDR) captures process execution, file operations, network connections, and code injection attempts. EDR provides visibility where network tools are blind and forensic data for incident investigation.
-
VirusTotal is a free public service for scanning files against 70+ antivirus engines. Complementary tools like YARA and strings analysis enable static malware detection without execution.
-
Sandboxes (Joe Sandbox, Cuckoo) safely execute malware in isolated environments and capture behavioral indicators. Behavioral analysis detects malware that bypasses signature-based detection.
-
Domain and IP reputation services (WHOIS, AbuseIPDB, GeoIP) provide geolocation and abuse history, enabling analysts to assess risk of external communication.
-
UEBA applies machine learning to detect anomalous user and system behavior, identifying compromised accounts and suspicious data access patterns.
-
Scripting (Python, PowerShell, shell) automates repetitive analyst tasks, scales threat intelligence queries, and orchestrates response actions through APIs.
-
APT28 case study demonstrates how multiple threat intelligence platforms are used in concert to understand threat actor capabilities, targets, and tools, informing detection tuning and hunting priorities.